Foot Locker 2011 Annual Report Download - page 57
Download and view the complete annual report
Please find page 57 of the 2011 Foot Locker annual report below. You can navigate through the pages in the report by either clicking on the pages listed below, or by using the keyword search tool below to find specific information within the annual report.-
 1
1 -
2
-
3
-
4
-
5
-
6
-
7
-
8
-
9
-
10
-
11
-
12
-
13
-
14
-
15
-
16
-
17
-
18
-
19
-
20
-
21
-
22
-
23
-
24
-
25
-
26
-
27
-
28
-
29
-
30
-
31
-
32
-
33
-
34
-
35
-
36
-
37
-
38
-
39
-
40
-
41
-
42
-
43
-
44
-
45
-
46
-
 47
47 -
 48
48 -
 49
49 -
 50
50 -
 51
51 -
 52
52 -
 53
53 -
 54
54 -
 55
55 -
 56
56 -
 57
57 -
 58
58 -
 59
59 -
 60
60 -
 61
61 -
 62
62 -
 63
63 -
 64
64 -
 65
65 -
 66
66 -
 67
67 -
68
-
69
-
70
-
71
-
72
-
73
-
74
-
75
-
76
-
77
-
78
-
79
-
80
-
81
-
82
-
83
-
84
-
85
-
86
-
87
-
88
-
89
-
90
-
91
-
92
-
93
-
94
-
95
-
96
-
97
-
98
-
99
-
100
-
101
-
102
-
103
-
104
-
105
-
106
-
107
-
108
 |
 |

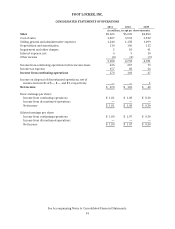
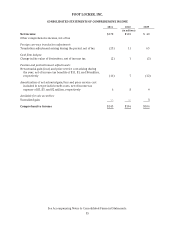
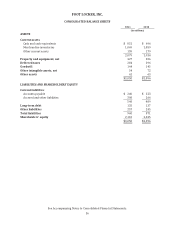
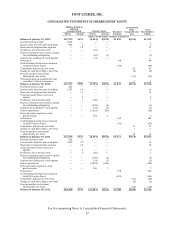
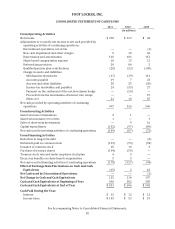
FOOT LOCKER, INC.
CONSOLIDATED STATEMENTS OF SHAREHOLDERS’ EQUITY
Additional Paid-In
Capital &
Common Stock Treasury Stock Retained
Earnings
Accumulated
Other
Comprehensive
Loss
Total
Shareholders’
EquityShares Amount Shares Amount
(shares in thousands, amounts in millions)
Balance at January 31, 2009 159,599 $691 (4,681) $(102) $1,581 $(246) $1,924
Restricted stock issued 1,004 — — — —
Issued under director and stock plans 664 6 — — 6
Share-based compensation expense — 12 — — 12
Forfeitures of restricted stock — — (10) — —
Shares of common stock used to satisfy
tax withholding obligations — — (32) (1) (1)
Acquired in exchange of stock options — — (3) — —
Net income 48 48
Cash dividends declared on common
stock ($0.60 per share) (94) (94)
Translation adjustment, net of tax 65 65
Change in cash flow hedges, net of tax (2) (2)
Pension and post-retirement
adjustments, net of tax (13) (13)
Unrealized gain on available-for-sale
securities, with no tax expense 33
Balance at January 30, 2010 161,267 $709 (4,726) $(103) $1,535 $(193) $1,948
Restricted stock issued 205 — — —
Issued under director and stock plans 1,187 10 — — 10
Share-based compensation expense — 13 — — 13
Total tax benefit from exercise of
options — 2 — — 2
Forfeitures of restricted stock — 1 (50) — 1
Shares of common stock used to satisfy
tax withholding obligations — — (292) (4) (4)
Acquired in exchange of stock options — — (34) (1) (1)
Share repurchases — — (3,215) (50) (50)
Reissued under employee stock
purchase plan — — 278 6 6
Net income 169 169
Cash dividends declared on common
stock ($0.60 per share) (93) (93)
Translation adjustment, net of tax 11 11
Change in cash flow hedges, net of tax 11
Pension and post-retirement
adjustments, net of tax 12 12
Balance at January 29, 2011 162,659 $735 (8,039) $(152) $1,611 $(169) $2,025
Restricted stock issued 242 — — — —
Issued under director and stock plans 1,559 19 — — 19
Share-based compensation expense — 18 — — 18
Total tax benefit from exercise of
options — 6 — — 6
Forfeitures of restricted stock — 1 (60) — 1
Shares of common stock used to satisfy
tax withholding obligations — — (140) (3) (3)
Acquired in exchange of stock options — — (34) (1) (1)
Share repurchases — — (4,904) (104) (104)
Reissued under employee stock
purchase plan — — 336 7 7
Net income 278 278
Cash dividends declared on common
stock ($0.66 per share) (101) (101)
Translation adjustment, net of tax (23) (23)
Change in cash flow hedges, net of tax (2) (2)
Pension and post-retirement
adjustments, net of tax (10) (10)
Balance at January 28, 2012 164,460 $779 (12,841) $(253) $1,788 $(204) $2,110
See Accompanying Notes to Consolidated Financial Statements.
37