Foot Locker 2011 Annual Report Download - page 65
Download and view the complete annual report
Please find page 65 of the 2011 Foot Locker annual report below. You can navigate through the pages in the report by either clicking on the pages listed below, or by using the keyword search tool below to find specific information within the annual report.-
 1
1 -
2
-
3
-
4
-
5
-
6
-
7
-
8
-
9
-
10
-
11
-
12
-
13
-
14
-
15
-
16
-
17
-
18
-
19
-
20
-
21
-
22
-
23
-
24
-
25
-
26
-
27
-
28
-
29
-
30
-
31
-
32
-
33
-
34
-
35
-
36
-
37
-
38
-
39
-
40
-
41
-
42
-
43
-
44
-
45
-
46
-
47
-
48
-
49
-
50
-
51
-
52
-
53
-
54
-
 55
55 -
 56
56 -
 57
57 -
 58
58 -
 59
59 -
 60
60 -
 61
61 -
 62
62 -
 63
63 -
 64
64 -
 65
65 -
 66
66 -
 67
67 -
 68
68 -
 69
69 -
 70
70 -
 71
71 -
 72
72 -
 73
73 -
 74
74 -
 75
75 -
76
-
77
-
78
-
79
-
80
-
81
-
82
-
83
-
84
-
85
-
86
-
87
-
88
-
89
-
90
-
91
-
92
-
93
-
94
-
95
-
96
-
97
-
98
-
99
-
100
-
101
-
102
-
103
-
104
-
105
-
106
-
107
-
108
 |
 |

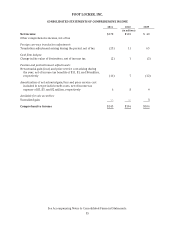
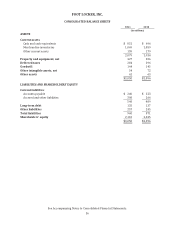
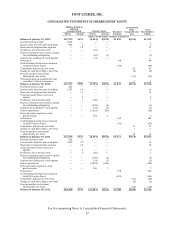
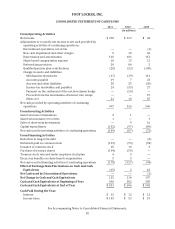
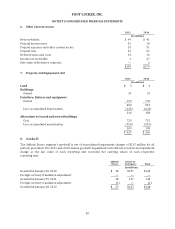
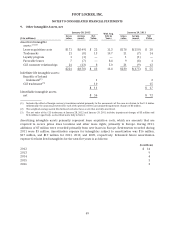
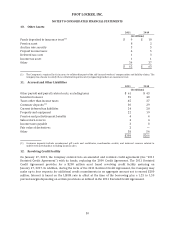
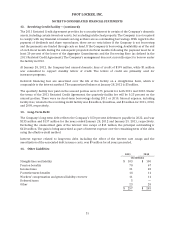
FOOT LOCKER, INC.
NOTES TO CONSOLIDATED FINANCIAL STATEMENTS
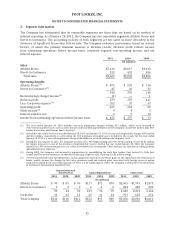
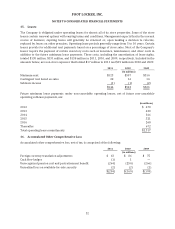
2. Segment Information
The Company has determined that its reportable segments are those that are based on its method of
internal reporting. As of January 28, 2012, the Company has two reportable segments, Athletic Stores and
Direct-to-Customers. The accounting policies of both segments are the same as those described in the
Summary of Significant Accounting Policies note. The Company evaluates performance based on several
factors, of which the primary financial measure is division results. Division profit reflects income
from continuing operations before income taxes, corporate expense, non-operating income, and net
interest expense.
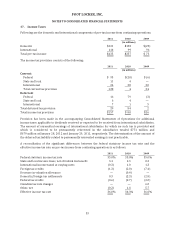
2011 2010 2009
(in millions)
Sales
Athletic Stores $5,110 $4,617 $4,448
Direct-to-Customers 513 432 406
Total sales $5,623 $5,049 $4,854
Operating Results
Athletic Stores
(1)
$ 495 $ 329 $ 114
Direct-to-Customers
(2)
45 30 32
540 359 146
Restructuring (charge) income
(3)
(1) — 1
Division profit 539 359 147
Less: Corporate expense
(4)
102 97 67
Operating profit 437 262 80
Other income
(5)
44 3
Interest expense, net 6 9 10
Income from continuing operations before income taxes $ 435 $ 257 $ 73
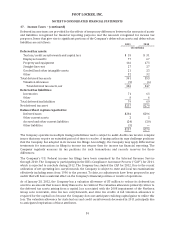
(1) The year ended January 30, 2010 includes non-cash impairment charges totaling $32 million, which were recorded to
write-down long-lived assets such as store fixtures and leasehold improvements at the Company’s Lady Foot Locker, Kids Foot
Locker, Footaction, and Champs Sports divisions.
(2) Included in the results for the year ended January 28, 2012 and January 29, 2011 are non-cash impairment charges of $5 million
and $10 million, respectively, to write down the CCS tradename intangible asset. Included in the results for the year ended
January 30, 2010 is a non-cash impairment charge of $4 million to write off software development costs.
(3) During the first quarter of 2011, the Company increased its 1993 Repositioning and 1991 Restructuring reserve by $1 million
for repairs necessary to one of the locations comprising this reserve. During the year ended January 30, 2010, the Company
adjusted its 1999 restructuring reserves to reflect a favorable lease termination. These amounts are included in selling, general,
and administrative expenses.
(4) During 2009, the Company restructured its organization by consolidating the Lady Foot Locker, Foot Locker U.S., Kids Foot
Locker, and Footaction businesses in addition to reducing corporate staff, resulting in a $5 million charge.
(5) Other income includes non-operating items, such as gains from insurance recoveries, gains on the repurchase and retirement of
bonds, royalty income, the changes in fair value, premiums paid and realized gains associated with foreign currency option
contracts. Included in the year ended January 29, 2011 is a $2 million gain to reflect the Company’s settlement of its investment
in the Reserve International Liquidity Fund.
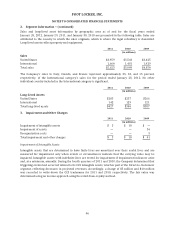
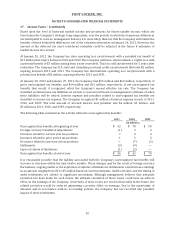
Depreciation and
Amortization Capital Expenditures Total Assets
2011 2010 2009 2011 2010 2009 2011 2010 2009
(in millions)
Athletic Stores $ 90 $ 85 $ 90 $117 $72 $70 $2,065 $1,993 $1,875
Direct-to-Customers 999645284280289
99 94 99 123 76 75 2,349 2,273 2,164
Corporate 11 12 13 29 21 14 701 623 652
Total Company $110 $106 $112 $152 $97 $89 $3,050 $2,896 $2,816
45