Foot Locker 2011 Annual Report Download - page 39
Download and view the complete annual report
Please find page 39 of the 2011 Foot Locker annual report below. You can navigate through the pages in the report by either clicking on the pages listed below, or by using the keyword search tool below to find specific information within the annual report.-
 1
1 -
2
-
3
-
4
-
5
-
6
-
7
-
8
-
9
-
10
-
11
-
12
-
13
-
14
-
15
-
16
-
17
-
18
-
19
-
20
-
21
-
22
-
23
-
24
-
25
-
26
-
27
-
28
-
 29
29 -
 30
30 -
 31
31 -
 32
32 -
 33
33 -
 34
34 -
 35
35 -
 36
36 -
 37
37 -
 38
38 -
 39
39 -
 40
40 -
 41
41 -
 42
42 -
 43
43 -
 44
44 -
 45
45 -
 46
46 -
 47
47 -
 48
48 -
 49
49 -
50
-
51
-
52
-
53
-
54
-
55
-
56
-
57
-
58
-
59
-
60
-
61
-
62
-
63
-
64
-
65
-
66
-
67
-
68
-
69
-
70
-
71
-
72
-
73
-
74
-
75
-
76
-
77
-
78
-
79
-
80
-
81
-
82
-
83
-
84
-
85
-
86
-
87
-
88
-
89
-
90
-
91
-
92
-
93
-
94
-
95
-
96
-
97
-
98
-
99
-
100
-
101
-
102
-
103
-
104
-
105
-
106
-
107
-
108
 |
 |

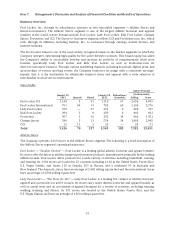
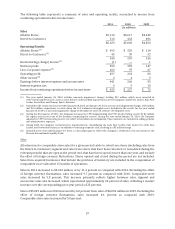
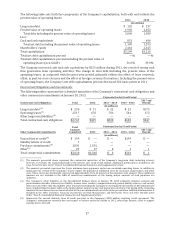
The following table represents a summary of sales and operating results, reconciled to income from
continuing operations before income taxes.
2011 2010 2009
(in millions)
Sales
Athletic Stores $5,110 $4,617 $4,448
Direct-to-Customers 513 432 406
$5,623 $5,049 $4,854
Operating Results
Athletic Stores
(1)
$ 495 $ 329 $ 114
Direct-to-Customers
(2)
45 30 32
540 359 146
Restructuring (charge) income
(3)
(1) — 1
Division profit 539 359 147
Less: Corporate expense
(4)
102 97 67
Operating profit 437 262 80
Other income
(5)
44 3
Earnings before interest expense and income taxes 441 266 83
Interest expense, net 6 9 10
Income from continuing operations before income taxes $ 435 $ 257 $ 73
(1) The year ended January 30, 2010 includes non-cash impairment charges totaling $32 million, which were recorded to
write-down long-lived assets such as store fixtures and leasehold improvements at the Company’s Lady Foot Locker, Kids Foot
Locker, Footaction, and Champs Sports divisions.
(2) Included in the results for the year ended January 28, 2012 and January 29, 2011 are non-cash impairment charges of $5 million
and $10 million, respectively, to write down the CCS tradename intangible asset. Included in the results for the year ended
January 30, 2010 is a non-cash impairment charge of $4 million to write off software development costs.
(3) During the first quarter of 2011, the Company increased its 1993 Repositioning and 1991 Restructuring reserve by $1 million
for repairs necessary to one of the locations comprising this reserve. During the year ended January 30, 2010, the Company
adjusted its 1999 restructuring reserves to reflect a favorable lease termination. These amounts are included in selling, general,
and administrative expenses.
(4) During 2009, the Company restructured its organization by consolidating the Lady Foot Locker, Foot Locker U.S., Kids Foot
Locker, and Footaction businesses in addition to reducing corporate staff, resulting in a $5 million charge.
(5) Included in the year ended January 29, 2011 is a $2 million gain to reflect the Company’s settlement of its investment in the
Reserve International Liquidity Fund.
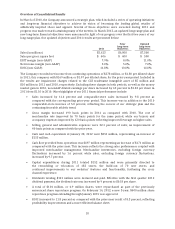
Sales
All references to comparable-store sales for a given period relate to sales from stores (including sales from
the Direct-to-Customers segment and sales from stores that have been relocated or remodeled during the
relevant periods) that are open at the period-end, that have been open for more than one year, and exclude
the effect of foreign currency fluctuations. Stores opened and closed during the period are not included.
Sales from acquired businesses that include the purchase of inventory are included in the computation of
comparable-store sales after 15 months of operations.
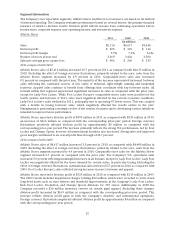
Sales in 2011 increased to $5,623 million, or by 11.4 percent as compared with 2010. Excluding the effect
of foreign currency fluctuations, sales increased 9.7 percent as compared with 2010. Comparable-store
sales increased by 9.8 percent. This increase primarily reflects higher footwear sales. Apparel and
accessories sales also increased, which represented approximately 24 percent of sales, reflecting a modest
increase over the corresponding prior-year period of 23 percent.
Sales of $5,049 million in 2010 increased by 4.0 percent from sales of $4,854 million in 2009. Excluding the
effect of foreign currency fluctuations, sales increased 4.6 percent as compared with 2009.
Comparable-store sales increased by 5.8 percent.
19