Foot Locker 2011 Annual Report Download - page 67
Download and view the complete annual report
Please find page 67 of the 2011 Foot Locker annual report below. You can navigate through the pages in the report by either clicking on the pages listed below, or by using the keyword search tool below to find specific information within the annual report.-
 1
1 -
2
-
3
-
4
-
5
-
6
-
7
-
8
-
9
-
10
-
11
-
12
-
13
-
14
-
15
-
16
-
17
-
18
-
19
-
20
-
21
-
22
-
23
-
24
-
25
-
26
-
27
-
28
-
29
-
30
-
31
-
32
-
33
-
34
-
35
-
36
-
37
-
38
-
39
-
40
-
41
-
42
-
43
-
44
-
45
-
46
-
47
-
48
-
49
-
50
-
51
-
52
-
53
-
54
-
55
-
56
-
 57
57 -
 58
58 -
 59
59 -
 60
60 -
 61
61 -
 62
62 -
 63
63 -
 64
64 -
 65
65 -
 66
66 -
 67
67 -
 68
68 -
 69
69 -
 70
70 -
 71
71 -
 72
72 -
 73
73 -
 74
74 -
 75
75 -
 76
76 -
 77
77 -
78
-
79
-
80
-
81
-
82
-
83
-
84
-
85
-
86
-
87
-
88
-
89
-
90
-
91
-
92
-
93
-
94
-
95
-
96
-
97
-
98
-
99
-
100
-
101
-
102
-
103
-
104
-
105
-
106
-
107
-
108
 |
 |

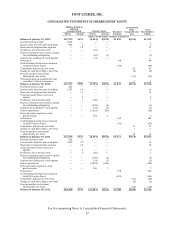
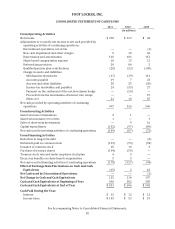
FOOT LOCKER, INC.
NOTES TO CONSOLIDATED FINANCIAL STATEMENTS
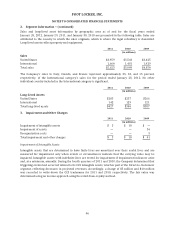
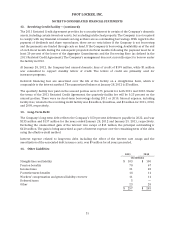
3. Impairment and Other Charges − (continued)
Impairment of Assets
No impairment charges related to long-lived assets were recorded during 2011 or 2010. During 2009, the
Company recorded non-cash impairment charges totaling $36 million; $32 million was recorded to
write-down long-lived assets at its Lady Foot Locker, Kids Foot Locker, Footaction, and Champs Sports
divisions, and a $4 million charge was recorded to write off certain software development costs for the
Direct-to-Customers segment as a result of management’s decision to terminate the project.
Reorganization Costs
In 2009, the Company consolidated the management team of the Lady Foot Locker business with the team
that managed the Foot Locker U.S., Kids Foot Locker, and Footaction businesses. As a result of this
divisional reorganization, as well as certain corporate staff reductions taken to improve corporate
efficiency, the Company recorded a charge of $5 million. This charge was comprised primarily of severance
costs to eliminate approximately 120 positions.
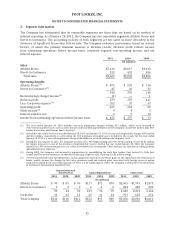
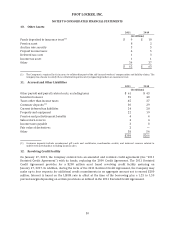
4. Other Income
Other income reflects non-operating income and includes items such as royalty income from the
Company’s franchising agreements, lease termination gains, realized gains/losses and premiums
associated with foreign currency option contracts, gains on the purchase and retirement of bonds, and
other non-operating items. Other income was $4 million in both 2011 and 2010 and was $3 million in
2009.
For 2011, other income primarily includes $2 million of lease termination gains related to the sales of
leasehold interests, $1 million for insurance recoveries, as well as royalty income. For 2010, other income
includes a $2 million gain on its money-market investment, as well as royalty income, and gains on lease
terminations related to certain lease interests in Europe. Other income in 2009 primarily reflects
$4 million related to gains from insurance recoveries, gains on the purchase and retirement of bonds, and
royalty income, partially offset by foreign currency option contract premiums of $1 million.
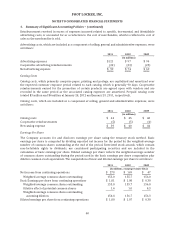
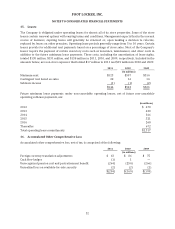
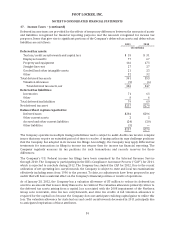
5. Merchandise Inventories
2011 2010
(in millions)
LIFO inventories $ 683 $ 694
FIFO inventories 386 365
Total merchandise inventories $1,069 $1,059
The value of the Company’s LIFO inventories, as calculated on a LIFO basis, approximates their value as
calculated on a FIFO basis.
47