Foot Locker 2011 Annual Report Download - page 44
Download and view the complete annual report
Please find page 44 of the 2011 Foot Locker annual report below. You can navigate through the pages in the report by either clicking on the pages listed below, or by using the keyword search tool below to find specific information within the annual report.-
 1
1 -
2
-
3
-
4
-
5
-
6
-
7
-
8
-
9
-
10
-
11
-
12
-
13
-
14
-
15
-
16
-
17
-
18
-
19
-
20
-
21
-
22
-
23
-
24
-
25
-
26
-
27
-
28
-
29
-
30
-
31
-
32
-
33
-
 34
34 -
 35
35 -
 36
36 -
 37
37 -
 38
38 -
 39
39 -
 40
40 -
 41
41 -
 42
42 -
 43
43 -
 44
44 -
 45
45 -
 46
46 -
 47
47 -
 48
48 -
 49
49 -
 50
50 -
 51
51 -
 52
52 -
 53
53 -
 54
54 -
55
-
56
-
57
-
58
-
59
-
60
-
61
-
62
-
63
-
64
-
65
-
66
-
67
-
68
-
69
-
70
-
71
-
72
-
73
-
74
-
75
-
76
-
77
-
78
-
79
-
80
-
81
-
82
-
83
-
84
-
85
-
86
-
87
-
88
-
89
-
90
-
91
-
92
-
93
-
94
-
95
-
96
-
97
-
98
-
99
-
100
-
101
-
102
-
103
-
104
-
105
-
106
-
107
-
108
 |
 |

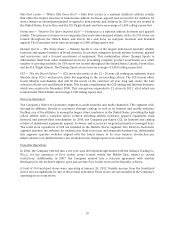
The Company may also from time to time repurchase its common stock or seek to retire or purchase
outstanding debt through open market purchases, privately negotiated transactions, or otherwise. Such
repurchases, if any, will depend on prevailing market conditions, liquidity requirements, contractual
restrictions, and other factors. The amounts involved may be material. On February 14, 2012, the
Company’s Board of Directors approved a new 3-year, $400 million share repurchase program extending
through January 2015, replacing the previous $250 million program.
Any material adverse change in customer demand, fashion trends, competitive market forces, or customer
acceptance of the Company’s merchandise mix and retail locations, uncertainties related to the effect of
competitive products and pricing, the Company’s reliance on a few key vendors for a significant portion of
its merchandise purchases and risks associated with global product sourcing, economic conditions
worldwide, the effects of currency fluctuations, as well as other factors listed under the heading
‘‘Disclosure Regarding Forward-Looking Statements,’’ could affect the ability of the Company to continue
to fund its needs from business operations.
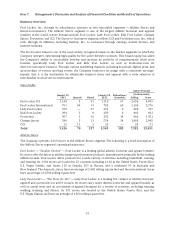
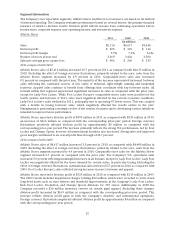
Maintaining access to merchandise that the Company considers appropriate for its business may be subject
to the policies and practices of its key vendors. Therefore, the Company believes that it is critical to
continue to maintain satisfactory relationships with its key vendors. In both 2011 and 2010, the Company
purchased approximately 82 percent of its merchandise from its top five vendors and expects to continue
to obtain a significant percentage of its athletic product from these vendors in future periods.
Approximately 61 percent in 2011 and 63 percent in 2010 was purchased from one vendor — Nike, Inc.
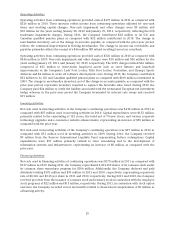
The Company’s 2012 planned capital expenditures and lease acquisition costs are approximately
$160 million. Planned capital expenditures are $147 million and planned lease acquisition costs related to
the Company’s operations in Europe are $13 million. The Company’s planned capital expenditures include
$110 million related to modernizations of existing stores and the planned opening of 82 new stores, as
well as $37 million for the development of information systems and infrastructure. The Company has the
ability to revise and reschedule much of the anticipated capital expenditure program, should the
Company’s financial position require it.
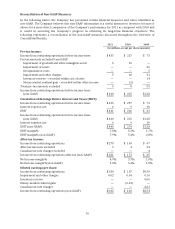
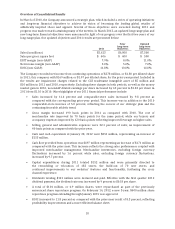
Free Cash Flow (non-GAAP measure)
In addition to net cash provided by operating activities, the Company uses free cash flow as a useful
measure of performance and as an indication of the strength of the Company and its ability to generate
cash. The Company defines free cash flow as net cash provided by operating activities less capital
expenditures (which is classified as an investing activity). The Company believes the presentation of free
cash flow is relevant and useful for investors because it allows investors to evaluate the cash generated
from the Company’s underlying operations in a manner similar to the method used by management. Free
cash flow is not defined under U.S. GAAP. Therefore, it should not be considered a substitute for income or
cash flow data prepared in accordance with U.S. GAAP and may not be comparable to similarly titled
measures used by other companies. It should not be inferred that the entire free cash flow amount is
available for discretionary expenditures.
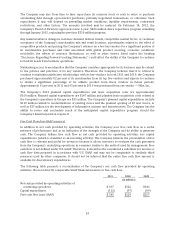
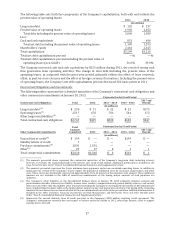
The following table presents a reconciliation of the Company’s net cash flow provided by operating
activities, the most directly comparable GAAP financial measure, to free cash flow.
2011 2010 2009
(in millions)
Net cash provided by operating activities of
continuing operations $ 497 $326 $346
Capital expenditures (152) (97) (89)
Free cash flow (non-GAAP) $ 345 $229 $257
24