Foot Locker 2011 Annual Report Download - page 60
Download and view the complete annual report
Please find page 60 of the 2011 Foot Locker annual report below. You can navigate through the pages in the report by either clicking on the pages listed below, or by using the keyword search tool below to find specific information within the annual report.-
 1
1 -
2
-
3
-
4
-
5
-
6
-
7
-
8
-
9
-
10
-
11
-
12
-
13
-
14
-
15
-
16
-
17
-
18
-
19
-
20
-
21
-
22
-
23
-
24
-
25
-
26
-
27
-
28
-
29
-
30
-
31
-
32
-
33
-
34
-
35
-
36
-
37
-
38
-
39
-
40
-
41
-
42
-
43
-
44
-
45
-
46
-
47
-
48
-
49
-
 50
50 -
 51
51 -
 52
52 -
 53
53 -
 54
54 -
 55
55 -
 56
56 -
 57
57 -
 58
58 -
 59
59 -
 60
60 -
 61
61 -
 62
62 -
 63
63 -
 64
64 -
 65
65 -
 66
66 -
 67
67 -
 68
68 -
 69
69 -
 70
70 -
71
-
72
-
73
-
74
-
75
-
76
-
77
-
78
-
79
-
80
-
81
-
82
-
83
-
84
-
85
-
86
-
87
-
88
-
89
-
90
-
91
-
92
-
93
-
94
-
95
-
96
-
97
-
98
-
99
-
100
-
101
-
102
-
103
-
104
-
105
-
106
-
107
-
108
 |
 |

FOOT LOCKER, INC.
NOTES TO CONSOLIDATED FINANCIAL STATEMENTS
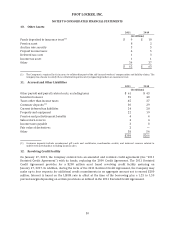
1. Summary of Significant Accounting Policies − (continued)
Reimbursement received in excess of expenses incurred related to specific, incremental, and identifiable
advertising costs, is accounted for as a reduction to the cost of merchandise, which is reflected in cost of
sales as the merchandise is sold.
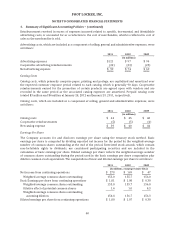
Advertising costs, which are included as a component of selling, general and administrative expenses, were
as follows:
2011 2010 2009
(in millions)
Advertising expenses $121 $ 97 $ 94
Cooperative advertising reimbursements (22) (23) (25)
Net advertising expense $ 99 $ 74 $ 69
Catalog Costs
Catalog costs, which primarily comprise paper, printing, and postage, are capitalized and amortized over
the expected customer response period related to each catalog, which is generally 90 days. Cooperative
reimbursements earned for the promotion of certain products are agreed upon with vendors and are
recorded in the same period as the associated catalog expenses are amortized. Prepaid catalog costs
totaled $3 million and $4 million at January 28, 2012 and January 29, 2011, respectively.
Catalog costs, which are included as a component of selling, general and administrative expenses, were
as follows:
2011 2010 2009
(in millions)
Catalog costs $ 44 $ 45 $ 48
Cooperative reimbursements (5) (5) (4)
Net catalog expense $ 39 $ 40 $ 44
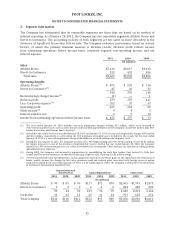
Earnings Per Share
The Company accounts for and discloses earnings per share using the treasury stock method. Basic
earnings per share is computed by dividing reported net income for the period by the weighted-average
number of common shares outstanding at the end of the period. Restricted stock awards, which contain
non-forfeitable rights to dividends, are considered participating securities and are included in the
calculation of basic earnings per share. Diluted earnings per share reflects the weighted-average number
of common shares outstanding during the period used in the basic earnings per share computation plus
dilutive common stock equivalents. The computation of basic and diluted earnings per share is as follows:
2011 2010 2009
(in millions, except per share data)
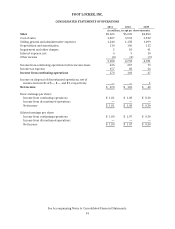
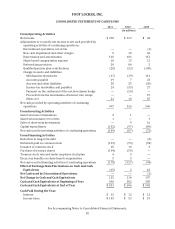
Net income from continuing operations $ 278 $ 169 $ 47
Weighted-average common shares outstanding 153.0 155.7 156.0
Basic Earnings per share from continuing operations $ 1.81 $ 1.08 $ 0.30
Weighted-average common shares outstanding 153.0 155.7 156.0
Dilutive effect of potential common shares 1.4 1.0 0.3
Weighted-average common shares outstanding
assuming dilution 154.4 156.7 156.3
Diluted earnings per share from continuing operations $ 1.80 $ 1.07 $ 0.30
40