Foot Locker 2011 Annual Report Download - page 58
Download and view the complete annual report
Please find page 58 of the 2011 Foot Locker annual report below. You can navigate through the pages in the report by either clicking on the pages listed below, or by using the keyword search tool below to find specific information within the annual report.-
 1
1 -
2
-
3
-
4
-
5
-
6
-
7
-
8
-
9
-
10
-
11
-
12
-
13
-
14
-
15
-
16
-
17
-
18
-
19
-
20
-
21
-
22
-
23
-
24
-
25
-
26
-
27
-
28
-
29
-
30
-
31
-
32
-
33
-
34
-
35
-
36
-
37
-
38
-
39
-
40
-
41
-
42
-
43
-
44
-
45
-
46
-
47
-
 48
48 -
 49
49 -
 50
50 -
 51
51 -
 52
52 -
 53
53 -
 54
54 -
 55
55 -
 56
56 -
 57
57 -
 58
58 -
 59
59 -
 60
60 -
 61
61 -
 62
62 -
 63
63 -
 64
64 -
 65
65 -
 66
66 -
 67
67 -
 68
68 -
69
-
70
-
71
-
72
-
73
-
74
-
75
-
76
-
77
-
78
-
79
-
80
-
81
-
82
-
83
-
84
-
85
-
86
-
87
-
88
-
89
-
90
-
91
-
92
-
93
-
94
-
95
-
96
-
97
-
98
-
99
-
100
-
101
-
102
-
103
-
104
-
105
-
106
-
107
-
108
 |
 |

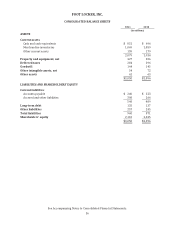
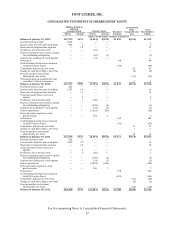
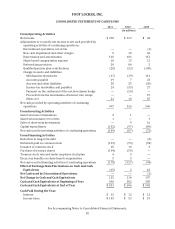
FOOT LOCKER, INC.
CONSOLIDATED STATEMENTS OF CASH FLOWS
2011 2010 2009
(in millions)
From Operating Activities
Net income $ 278 $ 169 $ 48
Adjustments to reconcile net income to net cash provided by
operating activities of continuing operations:
Discontinued operations, net of tax — — (1)
Non-cash impairment and other charges 5 10 36
Depreciation and amortization 110 106 112
Share-based compensation expense 18 13 12
Deferred tax provision 29 84 2
Qualified pension plan contributions (28) (32) (100)
Change in assets and liabilities:
Merchandise inventories (17) (19) 111
Accounts payable 19 7 23
Accrued and other liabilities 38 35 (30)
Income tax receivables and payables 24 (33) 27
Payment on the settlement of the net investment hedge — (24) —
Proceeds from the termination of interest rate swaps — — 19
Other, net 21 10 87
Net cash provided by operating activities of continuing
operations 497 326 346
From Investing Activities
Gain from lease terminations 2 1 —
Gain from insurance recoveries 1 — 1
Sales of short-term investments — 9 16
Capital expenditures (152) (97) (89)
Net cash used in investing activities of continuing operations (149) (87) (72)
From Financing Activities
Reduction in long-term debt — — (3)
Dividends paid on common stock (101) (93) (94)
Issuance of common stock 18 10 3
Purchase of treasury shares (104) (50) —
Treasury stock reissued under employee stock plan 4 3 —
Excess tax benefits on share-based compensation 5 3 —
Net cash used in financing activities of continuing operations (178) (127) (94)
Effect of Exchange Rate Fluctuations on Cash and Cash
Equivalents (15) 2 18
Net Cash used by Discontinued Operations — — (1)
Net Change in Cash and Cash Equivalents 155 114 197
Cash and Cash Equivalents at Beginning of Year 696 582 385
Cash and Cash Equivalents at End of Year $ 851 $ 696 $ 582
Cash Paid During the Year:
Interest $ 12 $ 12 $ 12
Income taxes $ 143 $ 53 $ 19
See Accompanying Notes to Consolidated Financial Statements.
38