Foot Locker 2011 Annual Report Download - page 47
Download and view the complete annual report
Please find page 47 of the 2011 Foot Locker annual report below. You can navigate through the pages in the report by either clicking on the pages listed below, or by using the keyword search tool below to find specific information within the annual report.-
 1
1 -
2
-
3
-
4
-
5
-
6
-
7
-
8
-
9
-
10
-
11
-
12
-
13
-
14
-
15
-
16
-
17
-
18
-
19
-
20
-
21
-
22
-
23
-
24
-
25
-
26
-
27
-
28
-
29
-
30
-
31
-
32
-
33
-
34
-
35
-
36
-
 37
37 -
 38
38 -
 39
39 -
 40
40 -
 41
41 -
 42
42 -
 43
43 -
 44
44 -
 45
45 -
 46
46 -
 47
47 -
 48
48 -
 49
49 -
 50
50 -
 51
51 -
 52
52 -
 53
53 -
 54
54 -
 55
55 -
 56
56 -
 57
57 -
58
-
59
-
60
-
61
-
62
-
63
-
64
-
65
-
66
-
67
-
68
-
69
-
70
-
71
-
72
-
73
-
74
-
75
-
76
-
77
-
78
-
79
-
80
-
81
-
82
-
83
-
84
-
85
-
86
-
87
-
88
-
89
-
90
-
91
-
92
-
93
-
94
-
95
-
96
-
97
-
98
-
99
-
100
-
101
-
102
-
103
-
104
-
105
-
106
-
107
-
108
 |
 |

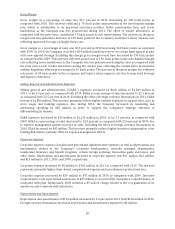
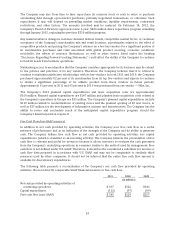
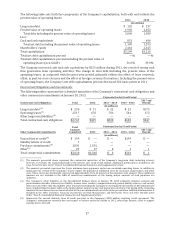
The following table sets forth the components of the Company’s capitalization, both with and without the
present value of operating leases: 2011 2010
(in millions)
Long-term debt $ 135 $ 137
Present value of operating leases 1,905 1,852
Total debt including the present value of operating leases 2,040 1,989
Less:
Cash and cash equivalents 851 696
Total net debt including the present value of operating leases 1,189 1,293
Shareholders’ equity 2,110 2,025
Total capitalization $3,299 $3,318
Total net debt capitalization percent —% —%
Total net debt capitalization percent including the present value of
operating leases (non-GAAP) 36.0% 39.0%
The Company increased cash and cash equivalents by $155 million during 2011, the result of strong cash
flow generation from operating activities. The change in total debt including the present value of the
operating leases, as compared with the prior-year period, primarily reflects the effect of lease renewals,
offset, in part, by store closures and the effect of foreign currency fluctuations. Including the present value
of operating leases, the Company’s net debt capitalization percent decreased 300 basis points in 2011.
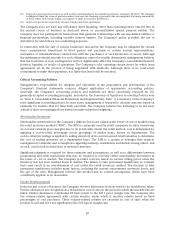
Contractual Obligations and Commitments
The following tables represent the scheduled maturities of the Company’s contractual cash obligations and
other commercial commitments at January 28, 2012: Payments Due by Fiscal Period
Contractual Cash Obligations Total 2012 2013 − 2014 2015 − 2016
2017 and
Beyond
(in millions)
Long-term debt
(1)
$ 230 $ 11 $ 22 $ 22 $175
Operating leases
(2)
2,517 478 786 581 672
Other long-term liabilities
(3)
———— —
Total contractual cash obligations $2,747 $489 $808 $603 $847
Total
Amounts
Committed
Payments Due by Fiscal Period
Other Commercial Commitments 2012 2013 − 2014 2015 − 2016
2017 and
Beyond
(in millions)
Unused line of credit
(4)
$ 199 $ — $ — $199 $ —
Standby letters of credit 1 — — 1 —
Purchase commitments
(5)
1,801 1,801 — — —
Other
(6)
27 17 8 1 1
Total commercial commitments $2,028 $1,818 $ 8 $201 $ 1
(1) The amounts presented above represent the contractual maturities of the Company’s long-term debt, including interest;
however, it excludes the unamortized gain of the interest rate swap of $15 million. Additional information is included in the
Long-Term Debt note under ‘‘Item 8. Consolidated Financial Statements and Supplementary Data.’’
(2) The amounts presented represent the future minimum lease payments under non-cancelable operating leases. In addition to
minimum rent, certain of the Company’s leases require the payment of additional costs for insurance, maintenance, and other
costs. These costs have historically represented approximately 25 to 30 percent of the minimum rent amount. These additional
amounts are not included in the table of contractual commitments as the timing and/or amounts of such payments are
unknown.
(3) The Company’s other liabilities in the Consolidated Balance Sheet at January 28, 2012 primarily comprise pension and
postretirement benefits, deferred rent liability, income taxes, workers’ compensation and general liability reserves, and various
other accruals. Other than this liability, other amounts (including the Company’s unrecognized tax benefits of $65 million) have
been excluded from the above table as the timing and/or amount of any cash payment is uncertain. The timing of the remaining
amounts that are known has not been included as they are minimal and not useful to the presentation. Additional information is
included in the Other Liabilities, Financial Instruments and Risk Management, and Retirement Plans and Other Benefits notes
under ‘‘Item 8. Consolidated Financial Statements and Supplementary Data.’’
(4) Represents the unused domestic lines of credit pursuant to the Company’s $200 million revolving credit agreement. The
Company’s management currently does not expect to borrow under the facility in 2012, other than amounts used to support
standby letters of credit.
27