Foot Locker 2011 Annual Report Download - page 87
Download and view the complete annual report
Please find page 87 of the 2011 Foot Locker annual report below. You can navigate through the pages in the report by either clicking on the pages listed below, or by using the keyword search tool below to find specific information within the annual report.-
 1
1 -
2
-
3
-
4
-
5
-
6
-
7
-
8
-
9
-
10
-
11
-
12
-
13
-
14
-
15
-
16
-
17
-
18
-
19
-
20
-
21
-
22
-
23
-
24
-
25
-
26
-
27
-
28
-
29
-
30
-
31
-
32
-
33
-
34
-
35
-
36
-
37
-
38
-
39
-
40
-
41
-
42
-
43
-
44
-
45
-
46
-
47
-
48
-
49
-
50
-
51
-
52
-
53
-
54
-
55
-
56
-
57
-
58
-
59
-
60
-
61
-
62
-
63
-
64
-
65
-
66
-
67
-
68
-
69
-
70
-
71
-
72
-
73
-
74
-
75
-
76
-
 77
77 -
 78
78 -
 79
79 -
 80
80 -
 81
81 -
 82
82 -
 83
83 -
 84
84 -
 85
85 -
 86
86 -
 87
87 -
 88
88 -
 89
89 -
 90
90 -
 91
91 -
 92
92 -
 93
93 -
 94
94 -
 95
95 -
 96
96 -
 97
97 -
98
-
99
-
100
-
101
-
102
-
103
-
104
-
105
-
106
-
107
-
108
 |
 |

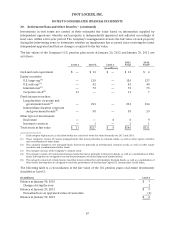
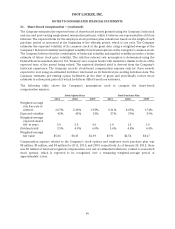
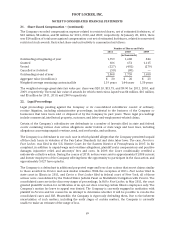
FOOT LOCKER, INC.
NOTES TO CONSOLIDATED FINANCIAL STATEMENTS
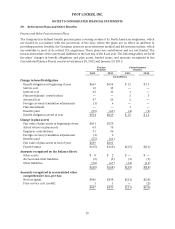
21. Share-Based Compensation − (continued)
The information set forth in the following table covers options granted under the Company’s stock
option plans:
2011 2010 2009
Number of
Shares
Weighted-
Average
Exercise
Price
Number of
Shares
Weighted-
Average
Exercise
Price
Number of
Shares
Weighted-
Average
Exercise
Price
(in thousands, except prices per share)
Options outstanding
at beginning of
year 7,220 $17.17 7,002 $16.88 6,080 $18.64
Granted 1,612 $19.13 1,311 $15.10 1,521 $10.02
Exercised (1,454) $13.02 (942) $11.65 (181) $ 8.76
Expired or cancelled (151) $17.38 (151) $20.41 (418) $21.03
Options outstanding
at end of year 7,227 $18.44 7,220 $17.17 7,002 $16.88
Options exercisable
at end of year 4,598 $19.35 5,088 $18.81 5,084 $18.85
Options available for
future grant at
end of year 7,155 10,339 2,214
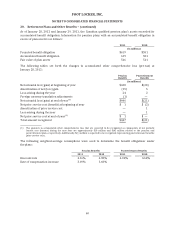
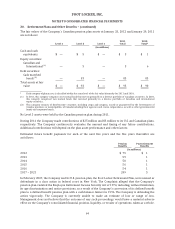
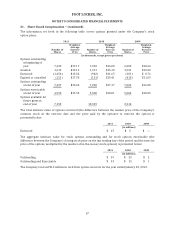
The total intrinsic value of options exercised (the difference between the market price of the Company’s
common stock on the exercise date and the price paid by the optionee to exercise the option) is
presented below:
2011 2010 2009
(in millions)
Exercised $ 15 $ 5 $ —
The aggregate intrinsic value for stock options outstanding and for stock options exercisable (the
difference between the Company’s closing stock price on the last trading day of the period and the exercise
price of the options, multiplied by the number of in-the-money stock options) is presented below:
2011 2010 2009
(in millions)
Outstanding $ 59 $ 23 $ 2
Outstanding and Exercisable $ 33 $ 13 $ 1
The Company received $18 million in cash from option exercises for the year ended January 28, 2012.
67