Foot Locker 2011 Annual Report Download - page 45
Download and view the complete annual report
Please find page 45 of the 2011 Foot Locker annual report below. You can navigate through the pages in the report by either clicking on the pages listed below, or by using the keyword search tool below to find specific information within the annual report.-
 1
1 -
2
-
3
-
4
-
5
-
6
-
7
-
8
-
9
-
10
-
11
-
12
-
13
-
14
-
15
-
16
-
17
-
18
-
19
-
20
-
21
-
22
-
23
-
24
-
25
-
26
-
27
-
28
-
29
-
30
-
31
-
32
-
33
-
34
-
 35
35 -
 36
36 -
 37
37 -
 38
38 -
 39
39 -
 40
40 -
 41
41 -
 42
42 -
 43
43 -
 44
44 -
 45
45 -
 46
46 -
 47
47 -
 48
48 -
 49
49 -
 50
50 -
 51
51 -
 52
52 -
 53
53 -
 54
54 -
 55
55 -
56
-
57
-
58
-
59
-
60
-
61
-
62
-
63
-
64
-
65
-
66
-
67
-
68
-
69
-
70
-
71
-
72
-
73
-
74
-
75
-
76
-
77
-
78
-
79
-
80
-
81
-
82
-
83
-
84
-
85
-
86
-
87
-
88
-
89
-
90
-
91
-
92
-
93
-
94
-
95
-
96
-
97
-
98
-
99
-
100
-
101
-
102
-
103
-
104
-
105
-
106
-
107
-
108
 |
 |

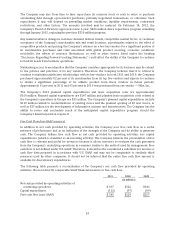
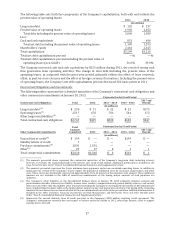
Operating Activities
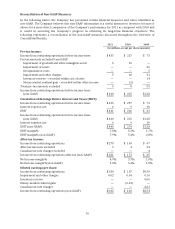
Operating activities from continuing operations provided cash of $497 million in 2011 as compared with
$326 million in 2010. These amounts reflect income from continuing operations adjusted for non-cash
items and working capital changes. Non-cash impairment and other charges were $5 million and
$10 million for the years ending January 28, 2012 and January 29, 2011, respectively, reflecting the CCS
tradename impairment charges. During 2011, the Company contributed $28 million to its U.S. and
Canadian qualified pension plans as compared with $32 million contributed in 2010. The change in
merchandise inventory, net of the change in accounts payable, as compared with the prior-year period,
reflects the continued improvement in flowing merchandise. The change in income tax receivables and
payables primarily reflects the receipt of a $46 million IRS refund resulting from a loss carryback.
Operating activities from continuing operations provided cash of $326 million in 2010 as compared with
$346 million in 2009. Non-cash impairment and other charges were $10 million and $36 million for the
years ending January 29, 2011 and January 30, 2010, respectively. The 2009 charges totaled $36 million,
comprised of $32 million to write-down long-lived assets such as store fixtures and leasehold
improvements at the Company’s Lady Foot Locker, Kids Foot Locker, Footaction, and Champs Sports
divisions and $4 million to write off software development costs. During 2010, the Company contributed
$32 million to its U.S. and Canadian qualified pension plans as compared with $100 million contributed in
2009. The change in merchandise inventory, net of the change in accounts payable, as compared with the
prior-year period, represents inventory required to support the favorable sales trend. During 2010, the
Company paid $24 million to settle the liability associated with the terminated European net investment
hedge, whereas in the prior-year period the Company terminated its interest rate swaps and received
$19 million.
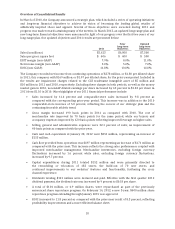
Investing Activities
Net cash used in investing activities of the Company’s continuing operations was $149 million in 2011 as
compared with $87 million used in investing activities in 2010. Capital expenditures were $152 million,
primarily related to the remodeling of 182 stores, the build-out of 70 new stores, and various corporate
technology upgrades and e-commerce website enhancements, representing an increase of $55 million as
compared with the prior year.
Net cash used in investing activities of the Company’s continuing operations was $87 million in 2010 as
compared with $72 million used in investing activities in 2009. During 2010, the Company received
$9 million from the Reserve International Liquidity Fund representing further redemptions. Capital
expenditures were $97 million primarily related to store remodeling and to the development of
information systems and infrastructure, representing an increase of $8 million as compared with the
prior year.
Financing Activities
Net cash used in financing activities of continuing operations was $178 million in 2011 as compared with
$127 million in 2010. During 2011, the Company repurchased 4,904,100 shares of its common stock under
its common share repurchase program for $104 million. Additionally, the Company declared and paid
dividends totaling $101 million and $93 million in 2011 and 2010, respectively, representing a quarterly
rate of $0.165 and $0.15 per share in 2011 and 2010, respectively. During 2011 and 2010, the Company
received proceeds from the issuance of common stock and treasury stock in connection with the employee
stock programs of $22 million and $13 million, respectively. During 2011, in connection with stock option
exercises, the Company recorded excess tax benefits related to share-based compensation of $5 million as
a financing activity.
25