Foot Locker 2011 Annual Report Download - page 41
Download and view the complete annual report
Please find page 41 of the 2011 Foot Locker annual report below. You can navigate through the pages in the report by either clicking on the pages listed below, or by using the keyword search tool below to find specific information within the annual report.-
 1
1 -
2
-
3
-
4
-
5
-
6
-
7
-
8
-
9
-
10
-
11
-
12
-
13
-
14
-
15
-
16
-
17
-
18
-
19
-
20
-
21
-
22
-
23
-
24
-
25
-
26
-
27
-
28
-
29
-
30
-
 31
31 -
 32
32 -
 33
33 -
 34
34 -
 35
35 -
 36
36 -
 37
37 -
 38
38 -
 39
39 -
 40
40 -
 41
41 -
 42
42 -
 43
43 -
 44
44 -
 45
45 -
 46
46 -
 47
47 -
 48
48 -
 49
49 -
 50
50 -
 51
51 -
52
-
53
-
54
-
55
-
56
-
57
-
58
-
59
-
60
-
61
-
62
-
63
-
64
-
65
-
66
-
67
-
68
-
69
-
70
-
71
-
72
-
73
-
74
-
75
-
76
-
77
-
78
-
79
-
80
-
81
-
82
-
83
-
84
-
85
-
86
-
87
-
88
-
89
-
90
-
91
-
92
-
93
-
94
-
95
-
96
-
97
-
98
-
99
-
100
-
101
-
102
-
103
-
104
-
105
-
106
-
107
-
108
 |
 |

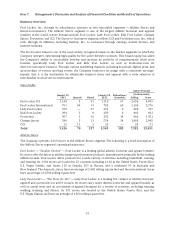
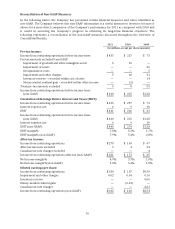
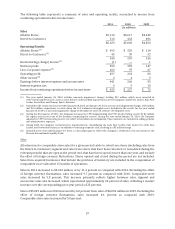
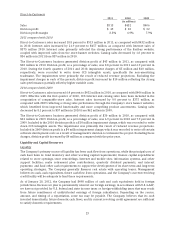
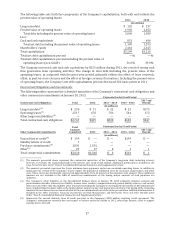
Depreciation and amortization of $106 million decreased by 5.4 percent in 2010 from $112 million in
2009. This decrease primarily reflects reduced depreciation and amortization resulting from store
long-lived asset impairment charges recorded in 2009. Additionally, foreign currency fluctuations reduced
depreciation and amortization expense by $1 million.
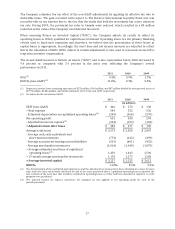
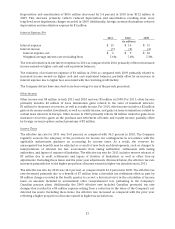
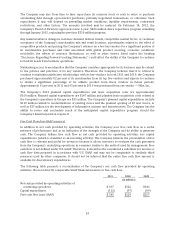
Interest Expense, Net
2011 2010 2009
(in millions)
Interest expense $ 13 $ 14 $ 13
Interest income (7) (5) (3)
Interest expense, net $ 6 $ 9 $ 10
Weighted-average interest rate (excluding fees) 7.6% 7.6% 7.3%
The overall reduction in net interest expense in 2011 as compared with 2010 primarily reflected increased
income earned on higher cash and cash equivalent balances.
The reduction of net interest expense of $1 million in 2010 as compared with 2009 primarily related to
increased income earned on higher cash and cash equivalent balances, partially offset by an increase in
interest expense due to higher fees associated with the revolving credit facility.
The Company did not have any short-term borrowings for any of the periods presented.
Other Income
Other income was $4 million in both 2011 and 2010 and was $3 million in 2009. For 2011, other income
primarily includes $2 million of lease termination gains related to the sales of leasehold interests,
$1 million for insurance recoveries, as well as royalty income. For 2010, other income includes a $2 million
gain on its money-market investment, as well as royalty income, and gains on lease terminations related to
certain lease interests in Europe. Other income in 2009 primarily reflects $4 million related to gains from
insurance recoveries, gains on the purchase and retirement of bonds, and royalty income, partially offset
by foreign currency option contract premiums of $1 million.
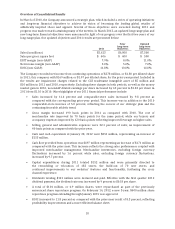
Income Taxes
The effective tax rate for 2011 was 36.0 percent, as compared with 34.3 percent in 2010. The Company
regularly assesses the adequacy of the provisions for income tax contingencies in accordance with the
applicable authoritative guidance on accounting for income taxes. As a result, the reserves for
unrecognized tax benefits may be adjusted as a result of new facts and developments, such as changes to
interpretations of relevant tax law, assessments from taxing authorities, settlements with taxing
authorities, and lapses of statutes of limitation. The effective tax rate for 2011 includes reserve releases of
$3 million due to audit settlements and lapses of statutes of limitations as well as other true-up
adjustments. Excluding these items and the prior-year adjustments discussed below, the effective tax rate
increased primarily due to the higher proportion of income earned in higher tax jurisdictions in 2011.
The effective tax rate for 2010 was 34.3 percent, as compared with 36.0 percent in 2009. The effective tax
rate decreased primarily due to a benefit of $7 million from a favorable tax settlement offset in part by
$4 million charge recorded in the fourth quarter to correct a historical error in the calculation of income
taxes on amounts included in accumulated other comprehensive loss pertaining to the Company’s
Canadian pension plans. Additionally, the 2009 effective rate included Canadian provincial tax rate
changes that resulted in a $4 million expense arising from a reduction in the value of the Company’s net
deferred tax assets. Excluding these items, the effective rate increased as compared with the prior year
reflecting a higher proportion of income earned in higher tax jurisdictions.
21