Family Dollar 2009 Annual Report Download - page 65
Download and view the complete annual report
Please find page 65 of the 2009 Family Dollar annual report below. You can navigate through the pages in the report by either clicking on the pages listed below, or by using the keyword search tool below to find specific information within the annual report.
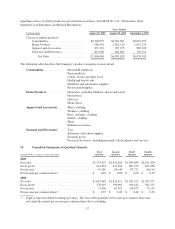
regarding classes of similar products is presented in accordance with SFAS No. 131, “Disclosures about
Segments of an Enterprise and Related Information.”
Years Ended
(in thousands) August 29, 2009 August 30, 2008 September 1, 2007
Classes of similar products:
Consumables ......................... $4,764,835 $4,263,681 $4,019,592
Home Products ....................... 988,550 1,002,110 1,035,276
Apparel and Accessories ............... 831,321 915,155 982,926
Seasonal and Electronics ............... 815,900 802,682 796,511
Net Sales ........................ $7,400,606 $6,983,628 $6,834,305
The following table describes the Company’s product categories in more detail:
Consumables ............. Household chemicals
Paper products
Candy, snacks and other food
Health and beauty aids
Hardware and automotive supplies
Pet food and supplies
Home Products ........... Domestics, including blankets, sheets and towels
Housewares
Giftware
Home décor
Apparel and Accessories . . . Men’s clothing
Women’s clothing
Boys’ and girls’ clothing
Infants’ clothing
Shoes
Fashion accessories
Seasonal and Electronics . . . Toys
Stationery and school supplies
Seasonal goods
Personal electronics, including pre-paid cellular phones and services
15. Unaudited Summaries of Quarterly Results:
(in thousands, except per share amounts)
First
Quarter
Second
Quarter
Third
Quarter
Fourth
Quarter
2009
Net sales ....................................... $1,753,833 $1,992,260 $1,843,089 $1,811,424
Gross profit ..................................... 614,453 671,304 667,192 625,256
Net income ..................................... 59,289 84,140 87,721 60,116
Net income per common share(1) ..................... $ 0.42 $ 0.60 $ 0.62 $ 0.43
2008
Net sales ....................................... $1,683,043 $1,832,611 $1,702,197 $1,765,777
Gross profit ..................................... 576,025 599,083 589,442 581,252
Net income ..................................... 51,946 63,303 64,673 53,151
Net income per common share(1) ..................... $ 0.37 $ 0.45 $ 0.46 $ 0.38
(1) Figures represent diluted earnings per share. The sum of the quarterly net income per common share may
not equal the annual net income per common share due to rounding.
57


