Family Dollar 2009 Annual Report Download - page 35
Download and view the complete annual report
Please find page 35 of the 2009 Family Dollar annual report below. You can navigate through the pages in the report by either clicking on the pages listed below, or by using the keyword search tool below to find specific information within the annual report.-
 1
1 -
2
-
3
-
4
-
5
-
6
-
7
-
8
-
9
-
10
-
11
-
12
-
13
-
14
-
15
-
16
-
17
-
18
-
19
-
20
-
21
-
22
-
23
-
24
-
 25
25 -
 26
26 -
 27
27 -
 28
28 -
 29
29 -
 30
30 -
 31
31 -
 32
32 -
 33
33 -
 34
34 -
 35
35 -
 36
36 -
 37
37 -
 38
38 -
 39
39 -
 40
40 -
 41
41 -
 42
42 -
 43
43 -
 44
44 -
 45
45 -
46
-
47
-
48
-
49
-
50
-
51
-
52
-
53
-
54
-
55
-
56
-
57
-
58
-
59
-
60
-
61
-
62
-
63
-
64
-
65
-
66
-
67
-
68
-
69
-
70
-
71
-
72
-
73
-
74
-
75
-
76
 |
 |

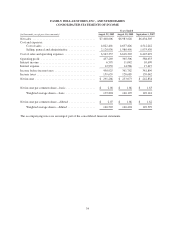
Cash used for investing activities increased $7.7 million in fiscal 2008 as compared to fiscal 2007. The
increase was due primarily to an increase in capital expenditures. The increase in capital expenditures was
substantially offset by a decrease in the net purchase/sale of investment securities, resulting from liquidity issues
in the auction rate securities market.
Cash flows from financing activities
During fiscal 2009, we had a cash outflow from financing activities of $140.1 million compared to a cash
outflow of $244.9 million during fiscal 2008. The change is due primarily to changes in cash overdrafts, an
increase in proceeds from the exercise of stock options, and a decrease in purchases of our common stock. Cash
overdrafts decreased $27.3 million in fiscal 2009 compared to fiscal 2008 and $79.7 million in fiscal 2008
compared to fiscal 2007. See Note 1 to the Consolidated Financial Statements included in this report for an
explanation of our cash overdrafts. Proceeds from the exercise of stock options increased $31.3 million in fiscal
2009 as compared to fiscal 2008. Purchases of our common stock decreased $26.6 million in fiscal 2009
compared to fiscal 2008.
Cash used in financing activities increased $28.4 million in fiscal 2008 as compared to fiscal 2007. The
increase was primarily a result of a decrease in cash overdrafts as a result of the timing of payments at year end
and a decrease in proceeds from the exercise of stock options. Lower expenditures related to stock repurchases
offset some of the increase.
Contractual Obligations and Other Commercial Commitments
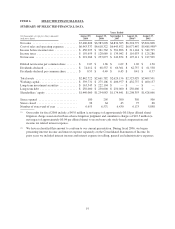
The following table shows our obligations and commitments to make future payments under contractual
obligations at the end of fiscal 2009:
Payments Due During the Period Ending
(in thousands)
Contractual Obligations Total
August
2010
August
2011
August
2012
August
2013
August
2014 Thereafter
Long-term debt .............. $ 250,000 $ — $ — $ 16,200 $ 16,200 $ 16,200 $201,400
Interest ..................... 78,529 13,387 13,387 12,609 11,760 10,912 16,474
Merchandise letters of credit .... 125,871 125,871—————
Operating leases .............. 1,414,094 329,022 289,628 241,683 191,842 138,307 223,612
Construction obligations ....... 2,817 2,817—————
Minimum royalties(1) .......... 13,950 2,350 2,550 2,750 2,800 2,800 700
Total ....................... $1,885,261 $473,447 $305,565 $273,242 $222,602 $168,219 $442,186
(1) Minimum royalty payments related to an exclusive agreement to sell certain branded merchandise.
At the end of fiscal 2009, approximately $50.5 million of the merchandise letters of credit were included in
accounts payable and accrued liabilities on our Consolidated Balance Sheet. Most of our operating leases provide
us with an option to extend the term of the lease at designated rates. See Item 2—“Properties” in this Report.
During the first quarter of fiscal 2008, we adopted FIN 48, which clarifies the accounting for income taxes
recognized in an enterprise’s financial statements. In accordance with FIN 48, we have recorded $39.4 million in
liabilities related to our uncertain tax positions as of August 29, 2009. At this time, we cannot reasonably
determine the timing of any payments related to these liabilities, except for $1.7 million which were classified as
current liabilities and may become payable within the next 12 months. See Note 7 to the Consolidated Financial
Statements included in this Report for more information on our adoption of FIN 48.
27