Family Dollar 2009 Annual Report Download - page 45
Download and view the complete annual report
Please find page 45 of the 2009 Family Dollar annual report below. You can navigate through the pages in the report by either clicking on the pages listed below, or by using the keyword search tool below to find specific information within the annual report.-
 1
1 -
2
-
3
-
4
-
5
-
6
-
7
-
8
-
9
-
10
-
11
-
12
-
13
-
14
-
15
-
16
-
17
-
18
-
19
-
20
-
21
-
22
-
23
-
24
-
25
-
26
-
27
-
28
-
29
-
30
-
31
-
32
-
33
-
34
-
 35
35 -
 36
36 -
 37
37 -
 38
38 -
 39
39 -
 40
40 -
 41
41 -
 42
42 -
 43
43 -
 44
44 -
 45
45 -
 46
46 -
 47
47 -
 48
48 -
 49
49 -
 50
50 -
 51
51 -
 52
52 -
 53
53 -
 54
54 -
 55
55 -
56
-
57
-
58
-
59
-
60
-
61
-
62
-
63
-
64
-
65
-
66
-
67
-
68
-
69
-
70
-
71
-
72
-
73
-
74
-
75
-
76
 |
 |

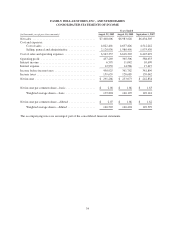
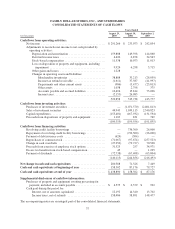
FAMILY DOLLAR STORES, INC., AND SUBSIDIARIES
CONSOLIDATED STATEMENTS OF CASH FLOWS
Years Ended
(in thousands)
August 29,
2009
August 30,
2008
September 1,
2007
Cash flows from operating activities:
Net income ............................................ $291,266 $ 233,073 $ 242,854
Adjustments to reconcile net income to net cash provided by
operating activities:
Depreciation and amortization ......................... 159,808 149,598 144,060
Deferred income taxes ............................... 4,426 6,878 34,543
Stock-based compensation ............................ 11,538 10,073 11,013
Loss on disposition of property and equipment, including
impairment ...................................... 9,924 6,298 3,715
Other gains and losses ............................... 1,228 — —
Changes in operating assets and liabilities:
Merchandise inventories ......................... 38,888 33,213 (28,039)
Income tax refund receivable ...................... (1,611) 37,387 (41,997)
Prepayments and other current assets ............... (986) (5,477) (23,813)
Other assets ................................... 1,038 2,798 375
Accounts payable and accrued liabilities ............. 16,494 15,814 73,066
Income taxes ................................... (2,155) 26,083 —
529,858 515,738 415,777
Cash flows from investing activities:
Purchases of investment securities .......................... — (1,071,570) (2,401,813)
Sales of investment securities ............................. 44,943 1,039,115 2,340,823
Capital expenditures ..................................... (155,401) (167,932) (131,594)
Proceeds from dispositions of property and equipment .......... 1,103 831 749
(109,355) (199,556) (191,835)
Cash flows from financing activities:
Revolving credit facility borrowings ........................ — 736,300 26,000
Repayment of revolving credit facility borrowings ............. — (736,300) (26,000)
Payment of debt issuance costs ............................ (624) (304) —
Repurchases of common stock ............................. (71,067) (97,674) (257,523)
Change in cash overdrafts ................................ (27,256) (79,727) 70,568
Proceeds from exercise of employee stock options ............. 31,525 257 34,971
Excess tax benefits from stock-based compensation ............ 45 — 1,295
Payment of dividends .................................... (72,738) (67,408) (65,804)
(140,115) (244,856) (216,493)
Net change in cash and cash equivalents ....................... 280,388 71,326 7,449
Cash and cash equivalents at beginning of year ................. 158,502 87,176 79,727
Cash and cash equivalents at end of year ...................... $438,890 $ 158,502 $ 87,176
Supplemental disclosures of cash flow information:
Purchases of property and equipment awaiting processing for
payment, included in accounts payable .................... $ 4,575 $ 6,579 $ 992
Cash paid during the period for:
Interest, net of amounts capitalized ..................... 12,192 14,340 13,702
Income taxes, net of refunds .......................... 158,486 58,891 148,477
The accompanying notes are an integral part of the consolidated financial statements.
37