Family Dollar 2009 Annual Report Download - page 44
Download and view the complete annual report
Please find page 44 of the 2009 Family Dollar annual report below. You can navigate through the pages in the report by either clicking on the pages listed below, or by using the keyword search tool below to find specific information within the annual report.-
 1
1 -
2
-
3
-
4
-
5
-
6
-
7
-
8
-
9
-
10
-
11
-
12
-
13
-
14
-
15
-
16
-
17
-
18
-
19
-
20
-
21
-
22
-
23
-
24
-
25
-
26
-
27
-
28
-
29
-
30
-
31
-
32
-
33
-
 34
34 -
 35
35 -
 36
36 -
 37
37 -
 38
38 -
 39
39 -
 40
40 -
 41
41 -
 42
42 -
 43
43 -
 44
44 -
 45
45 -
 46
46 -
 47
47 -
 48
48 -
 49
49 -
 50
50 -
 51
51 -
 52
52 -
 53
53 -
 54
54 -
55
-
56
-
57
-
58
-
59
-
60
-
61
-
62
-
63
-
64
-
65
-
66
-
67
-
68
-
69
-
70
-
71
-
72
-
73
-
74
-
75
-
76
 |
 |

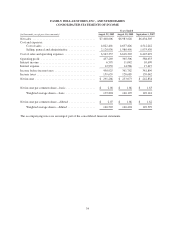
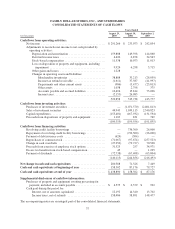
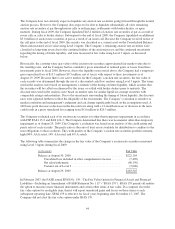
FAMILY DOLLAR STORES, INC., AND SUBSIDIARIES
CONSOLIDATED STATEMENTS OF SHAREHOLDERS’ EQUITY
Years Ended August 29, 2009, August 30, 2008, and September 1, 2007
(in thousands, except per share and share
amounts)
Common
stock
Capital in
excess of par
Retained
earnings
Accumulated
other
comprehensive
loss
Treasury
stock Total
Balance, August 26, 2006
(178,559,411 shares common stock;
28,348,927 shares treasury stock) ......... $17,856 $140,829 $1,546,366 $ — $(496,658) $1,208,393
Net income for the year .................... 242,854 242,854
Issuance of 1,326,823 common shares under
incentive plans, including tax benefits ....... 133 35,441 35,574
Purchase of 8,199,000 common shares for
treasury ............................... (257,523) (257,523)
Issuance of 5,985 shares of treasury stock under
incentive plans (Director compensation) ..... 91 119 210
Stock-based compensation .................. 11,494 11,494
Dividends on common stock, $.45 per share .... (66,361) (66,361)
Balance, September 1, 2007
(179,886,234 shares common stock;
36,541,942 shares treasury stock) ......... 17,989 187,855 1,722,859 — (754,062) 1,174,641
FIN 48 Adoption .......................... 912 912
Balance as adjusted, September 1, 2007 ........ 17,989 187,855 1,723,771 — (754,062) 1,175,553
Net income for the year .................... 233,073 233,073
Unrealized loss on investment securities (net of
$3.0 million of taxes) .................... (4,862) (4,862)
Comprehensive income .................... 228,211
Issuance of 65,014 common shares under
incentive plans, including tax benefits ....... 6 201 207
Purchase of 3,719,054 common shares for
treasury ............................... (97,674) (97,674)
Issuance of 14,290 shares of treasury under
incentive plan (Director compensation) ...... (56) 302 246
Retirement of 35,818,927 shares of treasury
stock ................................. (3,582) (37,408) (717,655) 758,645 —
Stock-based compensation .................. 16,077 16,077
Dividends on common stock, $.49 per share .... (68,537) (68,537)
Balance, August 30, 2008
(139,704,542 shares common stock; 4,427,779
shares treasury stock) .................. 14,413 166,669 1,170,652 (4,862) (92,789) 1,254,083
Net income for the year .................... 291,266 291,266
Unrealized gains (losses) on investment
securities (net of $2.5 million of taxes) ...... (4,626) (4,626)
Reclassification adjustment for (gains) losses
realized in net income (net of $0.3 million of
taxes) ................................. 528 528
Comprehensive income .................... 287,168
Issuance of 1,353,413 common shares under
incentive plans, including tax benefits ....... 136 31,450 31,586
Purchase of 2,271,528 common shares for
treasury ............................... (71,067) (71,067)
Issuance of 9,405 shares of treasury stock under
incentive plans (Director compensation) ..... 197 73 270
Stock-based compensation .................. 12,033 12,033
Dividends on common stock, $.53 per share .... (74,013) (74,013)
Balance, August 29, 2009
(138,795,832 shares common stock; 6,689,902
shares treasury stock) .................. $14,549 $210,349 $1,387,905 $(8,960) $(163,783) $1,440,060
The accompanying notes are an integral part of the consolidated financial statements.
36