Family Dollar 2009 Annual Report Download - page 32
Download and view the complete annual report
Please find page 32 of the 2009 Family Dollar annual report below. You can navigate through the pages in the report by either clicking on the pages listed below, or by using the keyword search tool below to find specific information within the annual report.-
 1
1 -
2
-
3
-
4
-
5
-
6
-
7
-
8
-
9
-
10
-
11
-
12
-
13
-
14
-
15
-
16
-
17
-
18
-
19
-
20
-
21
-
 22
22 -
 23
23 -
 24
24 -
 25
25 -
 26
26 -
 27
27 -
 28
28 -
 29
29 -
 30
30 -
 31
31 -
 32
32 -
 33
33 -
 34
34 -
 35
35 -
 36
36 -
 37
37 -
 38
38 -
 39
39 -
 40
40 -
 41
41 -
 42
42 -
43
-
44
-
45
-
46
-
47
-
48
-
49
-
50
-
51
-
52
-
53
-
54
-
55
-
56
-
57
-
58
-
59
-
60
-
61
-
62
-
63
-
64
-
65
-
66
-
67
-
68
-
69
-
70
-
71
-
72
-
73
-
74
-
75
-
76
 |
 |
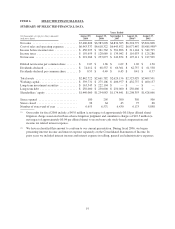
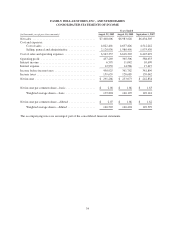
to bonus and other performance-based compensation accruals to reflect our strong performance during fiscal
2009. We continued to see favorable trends in workers’ compensation and general liability claims during fiscal
2009, but the rate of improvement was lower as compared to fiscal 2008, resulting in an increase in insurance
expense as a percentage of net sales.
The increase in SG&A expenses, as a percentage of net sales, in fiscal 2008 as compared to fiscal 2007, was
due primarily to an increase in occupancy costs and an increase in advertising costs. In addition, most costs in
fiscal 2008 were de-leveraged as a result of low single-digit comparable store sales growth. These increases
offset a decrease in insurance costs and a decrease in professional fees.
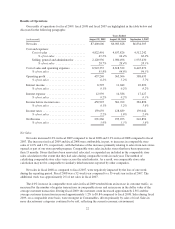
Interest Income
Interest income decreased approximately 40.3% ($4.4 million) in fiscal 2009 compared to fiscal 2008 and
increased approximately 3.3% ($0.4 million) in fiscal 2008 compared to fiscal 2007. The decrease in interest
income during fiscal 2009 as compared to fiscal 2008, was due to a decrease in interest rates. The increase in
fiscal 2008 as compared to fiscal 2007 was not material.
Interest Expense
Interest expense decreased 11.3% ($1.6 million) in fiscal 2009 compared to fiscal 2008 and 16.3% ($2.8
million) in fiscal 2008 compared to fiscal 2007. We did not borrow under our revolving credit facilities during
fiscal 2009, which resulted in a decrease in interest expense as compared to fiscal 2008. During fiscal 2008, we
incurred $1.7 million in interest expense related to our revolving credit facilities. The decrease in fiscal 2008 as
compared to fiscal 2007 was due to an accounting policy change in the classification of tax-related interest and
penalties in connection with our adoption of FIN 48. Tax-related interest and penalties were included in interest
expense during fiscal 2007.
Income Taxes
The effective tax rate was 35.4% for fiscal 2009, 35.6% in fiscal 2008 and 36.4% in fiscal 2007. The
decrease in the effective tax rate in fiscal 2009 as compared to fiscal 2008 was due primarily to an increase in
certain federal jobs tax credits and changes in state income taxes, offset partially by changes in our liabilities for
uncertain tax positions and a decrease in tax-exempt interest income. The decrease in the effective rate in fiscal
2008 compared to fiscal 2007 was due primarily to a decrease in our tax liabilities as a result of the expiration of
the statute of limitations with respect to uncertain tax positions and favorable settlements with taxing authorities.
Liquidity and Capital Resources
General
We have consistently maintained a strong liquidity position. Cash provided by operating activities during
fiscal 2009 was $529.9 million compared to $515.7 million in fiscal 2008 and $415.8 million in fiscal 2007.
These amounts have enabled us to fund our regular operating needs, capital expenditure program, cash dividend
payments, interest payments, and share repurchases. We believe operating cash flows and existing credit
facilities will provide sufficient liquidity for our ongoing operations and growth initiatives.
24