Family Dollar 2009 Annual Report Download - page 31
Download and view the complete annual report
Please find page 31 of the 2009 Family Dollar annual report below. You can navigate through the pages in the report by either clicking on the pages listed below, or by using the keyword search tool below to find specific information within the annual report.-
 1
1 -
2
-
3
-
4
-
5
-
6
-
7
-
8
-
9
-
10
-
11
-
12
-
13
-
14
-
15
-
16
-
17
-
18
-
19
-
20
-
 21
21 -
 22
22 -
 23
23 -
 24
24 -
 25
25 -
 26
26 -
 27
27 -
 28
28 -
 29
29 -
 30
30 -
 31
31 -
 32
32 -
 33
33 -
 34
34 -
 35
35 -
 36
36 -
 37
37 -
 38
38 -
 39
39 -
 40
40 -
 41
41 -
42
-
43
-
44
-
45
-
46
-
47
-
48
-
49
-
50
-
51
-
52
-
53
-
54
-
55
-
56
-
57
-
58
-
59
-
60
-
61
-
62
-
63
-
64
-
65
-
66
-
67
-
68
-
69
-
70
-
71
-
72
-
73
-
74
-
75
-
76
 |
 |
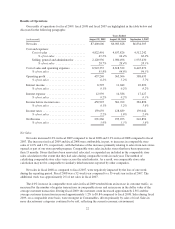
The 1.2% increase in comparable store sales in fiscal 2008 resulted from an increase in the average
customer transaction. During fiscal 2008, the customer count, as measured by the number of register transactions
in comparable stores, was approximately flat (0.3% decrease), and the average customer transaction increased
approximately 1.5% to $9.70 compared to fiscal 2007. Sales during fiscal 2008, on a comparable store basis,
were strongest in Consumables. Sales in more discretionary categories were weaker.
During fiscal 2009, we opened 180 stores and closed 96 stores for a net addition of 84 stores, compared with
the opening of 205 stores and closing of 64 stores for a net addition of 141 stores during fiscal 2008. We
relocated 10 stores in fiscal 2009, compared with 17 stores that were relocated in fiscal 2008. We also expanded
or renovated 41 stores in fiscal 2009, compared with 80 stores that were expanded or renovated in fiscal 2008. In
addition, during fiscal 2009, we initiated efforts to re-align space in our stores to accommodate strong customer
demand for consumable merchandise and improve the in-store shopping experience. Approximately 48% of the
chain was impacted by these efforts during fiscal 2009.
Cost of Sales
Cost of sales increased 4.0% in fiscal 2009 compared to fiscal 2008 and 2.8% in fiscal 2008 compared to
fiscal 2007. These increases primarily reflected the additional sales volume between years. The increase in fiscal
2008 compared to fiscal 2007 was impacted by the loss of one week during the reporting period, as discussed
above. Cost of sales, as a percentage of net sales, was 65.2% in fiscal 2009, 66.4% in fiscal 2008 and 66.0% in
fiscal 2007. The decrease in cost of sales, as a percentage of net sales, during fiscal 2009 as compared to fiscal
2008, was due primarily to lower freight expense, lower inventory shrinkage, and lower seasonal markdowns. In
addition, higher purchase mark-ups more than offset the effect of stronger sales of lower-margin consumable
merchandise. Freight expense benefited from lower diesel costs and increased transportation productivity and
efficiency. We believe that inventory shrinkage benefited from higher store manager retention, lower levels of
discretionary merchandise and improved analytics and monitoring processes. As a result of the shift in the
merchandise sales mix to more consumable merchandise and our continued focus on managing inventory risk,
we lowered inventory levels in our discretionary merchandise categories, which resulted in lower seasonal
markdowns, especially during the first half of fiscal 2009. The increase in purchase mark-ups was due primarily
to our price management work, including zone pricing and price optimization.
The increase in cost of sales, as a percentage of net sales, during fiscal 2008 as compared to fiscal 2007, was
due primarily to increased sales of lower-margin consumable merchandise.
The Consumer Product Safety Improvement Act of 2008 was signed into law in August 2008. The new
legislation addresses a number of consumer product safety issues, including the permissible levels of lead and
phthalates in certain products. During fiscal 2009, we incurred markdown expense of approximately $6.8 million
in response to the new legislation.
Selling, General and Administrative Expenses
SG&A expenses increased 7.1% in fiscal 2009 compared to fiscal 2008 and 2.4% in fiscal 2008 compared to
fiscal 2007. The increases in these expenses were due in part to additional costs arising from the continued
growth in the number of stores in operation. In fiscal 2009, we also incurred additional costs to support higher
sales volume. The increase in fiscal 2008 as compared to fiscal 2007 was impacted by the loss of one week
during the reporting period, as discussed above. SG&A expenses, as a percentage of net sales, were 28.7% in
fiscal 2009, 28.4% in fiscal 2008 and 28.3% in fiscal 2007. The increase in SG&A expenses, as a percentage of
net sales, during fiscal 2009 as compared to fiscal 2008, was due primarily to higher incentive compensation
(approximately 0.3% of net sales) and higher insurance expense (approximately 0.3% of net sales). Most other
costs decreased as a percentage of net sales, including payroll costs (approximately 0.1% of net sales) and
occupancy costs (approximately 0.1% of net sales), as a result of a 4.0% increase in comparable store sales and
our continued focus on expense control. The increase in incentive compensation was due to certain adjustments
23