Family Dollar 2009 Annual Report Download - page 12
Download and view the complete annual report
Please find page 12 of the 2009 Family Dollar annual report below. You can navigate through the pages in the report by either clicking on the pages listed below, or by using the keyword search tool below to find specific information within the annual report.-
 1
1 -
 2
2 -
 3
3 -
 4
4 -
 5
5 -
 6
6 -
 7
7 -
 8
8 -
 9
9 -
 10
10 -
 11
11 -
 12
12 -
 13
13 -
 14
14 -
 15
15 -
 16
16 -
 17
17 -
 18
18 -
 19
19 -
 20
20 -
 21
21 -
 22
22 -
23
-
24
-
25
-
26
-
27
-
28
-
29
-
30
-
31
-
32
-
33
-
34
-
35
-
36
-
37
-
38
-
39
-
40
-
41
-
42
-
43
-
44
-
45
-
46
-
47
-
48
-
49
-
50
-
51
-
52
-
53
-
54
-
55
-
56
-
57
-
58
-
59
-
60
-
61
-
62
-
63
-
64
-
65
-
66
-
67
-
68
-
69
-
70
-
71
-
72
-
73
-
74
-
75
-
76
 |
 |

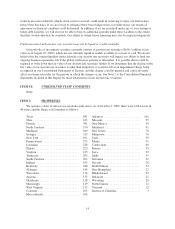
Merchandise
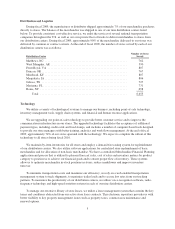
Our stores offer a variety of general merchandise. The following table summarizes the percentage of net
sales attributable to each product category over the last three fiscal years:
Product Category 2009 2008 2007
Consumables .................................................... 64.4% 61.0% 58.8%
Home Products ................................................... 13.4% 14.4% 15.1%
Apparel and Accessories ........................................... 11.2% 13.1% 14.4%
Seasonal and Electronics ........................................... 11.0% 11.5% 11.7%
The following table describes our product categories in more detail:
Consumables ............. Household chemicals
Paper products
Candy, snacks and other food
Health and beauty aids
Hardware and automotive supplies
Pet food and supplies
Home Products ........... Domestics, including blankets, sheets and towels
Housewares
Giftware
Home décor
Apparel and Accessories . . . Men’s clothing
Women’s clothing
Boys’ and girls’ clothing
Infants’ clothing
Shoes
Fashion accessories
Seasonal and Electronics . . . Toys
Stationery and school supplies
Seasonal goods
Personal electronics, including pre-paid cellular phones and services
During fiscal 2009, nationally advertised brand name merchandise accounted for approximately 52% of
sales. Merchandise sold under our private label program, across all merchandise categories, accounted for
approximately 19% of sales. Merchandise sold under other labels, or which was unlabeled, accounted for the
balance of sales. During fiscal 2009, closeout merchandise accounted for approximately 2% of sales.
We purchase merchandise from a wide variety of suppliers and generally have not experienced difficulty in
obtaining adequate quantities of merchandise. In fiscal 2009, no single supplier accounted for more than 8% of
the merchandise sold by us. Approximately 54% of our merchandise was manufactured in the U.S., and
substantially all such merchandise was purchased directly from the manufacturer. Approximately 46% of our
merchandise was manufactured overseas and was purchased using domestic importers, agents or directly from
the manufacturer. Our vendor arrangements provide for payment for such merchandise in U.S. Dollars.
We maintain a substantial variety and depth of merchandise inventory in stock in our stores (and in our
distribution centers for weekly store replenishment) to attract customers and meet their shopping needs. We
negotiate vendors’ trade payment terms to help finance the cost of carrying this inventory. We balance the value
of maintaining high inventory levels required to meet customer demand with the potential risk of having
inventories at levels that exceed such demand and that may need to be marked down in price in order to sell.
4