Family Dollar 2009 Annual Report Download - page 34
Download and view the complete annual report
Please find page 34 of the 2009 Family Dollar annual report below. You can navigate through the pages in the report by either clicking on the pages listed below, or by using the keyword search tool below to find specific information within the annual report.-
 1
1 -
2
-
3
-
4
-
5
-
6
-
7
-
8
-
9
-
10
-
11
-
12
-
13
-
14
-
15
-
16
-
17
-
18
-
19
-
20
-
21
-
22
-
23
-
 24
24 -
 25
25 -
 26
26 -
 27
27 -
 28
28 -
 29
29 -
 30
30 -
 31
31 -
 32
32 -
 33
33 -
 34
34 -
 35
35 -
 36
36 -
 37
37 -
 38
38 -
 39
39 -
 40
40 -
 41
41 -
 42
42 -
 43
43 -
 44
44 -
45
-
46
-
47
-
48
-
49
-
50
-
51
-
52
-
53
-
54
-
55
-
56
-
57
-
58
-
59
-
60
-
61
-
62
-
63
-
64
-
65
-
66
-
67
-
68
-
69
-
70
-
71
-
72
-
73
-
74
-
75
-
76
 |
 |
technology-related projects and improvements and upgrades to existing stores. The increase in capital
expenditures during fiscal 2008 as compared to fiscal 2007 was due to an increase in existing store improvements
and upgrades and an increase in technology investments. Capital expenditures for fiscal 2010 are expected to be
between $160 and $180 million and relate primarily to store technology infrastructure and other technology
related projects; new store openings; existing stores, to include expansions, relocations and renovations; and
distribution center improvements.
In fiscal 2009, we opened 180 stores, closed 96 stores and expanded, relocated, or renovated 51 stores. In
addition, during fiscal 2009, we initiated efforts to re-align space in our stores to accommodate strong customer
demand for consumable merchandise and improve the in-store shopping experience. Approximately 48% of the
chain was impacted by these efforts during fiscal 2009. We plan to continue re-aligning the space in our stores
during fiscal 2010. We occupy most of our stores under operating leases. Store opening, closing, expansion,
relocation, and renovation plans, as well as overall capital expenditure plans, are continuously reviewed and may
change. During fiscal 2010, we plan to open approximately 200 stores and close approximately 80 stores.
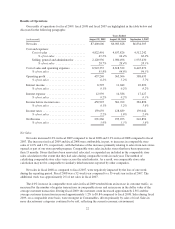
During fiscal 2009, we purchased 2.3 million shares of our common stock at a cost of $71.1 million. During
fiscal 2008, we purchased 3.7 million shares at a cost of $97.7 million, and during fiscal 2007, we purchased
8.2 million shares at a cost of $257.5 million. As of August 29, 2009, we had outstanding authorizations to
purchase a total of $62.0 million of our common stock. The timing and amount of any shares repurchased have
been and will continue to be determined by management based on its evaluation of market conditions and other
factors. Our repurchase program does not have a stated expiration date, and purchases may be made through open
market purchases, private market transactions or transactions structured through investment banking institutions.
Our wholly-owned captive insurance subsidiary maintains certain balances in cash and cash equivalents and
investment securities that are used in connection with our retained workers’ compensation, general liability and
automobile liability risks and are not designated for general corporate purposes. As of the end of fiscal 2009,
these cash and cash equivalents and investment securities balances were $58.6 million and $59.3 million,
respectively.
Cash flows from operating activities
Cash provided by operating activities increased $14.1 million during fiscal 2009 as compared to fiscal 2008.
The increase was due primarily to an increase in net income, partially offset by changes in income tax receivable/
payable amounts. The changes in the income tax receivable/payable amounts were primarily due to a tax refund
received during fiscal 2008 in connection with the formation of our captive insurance subsidiary.
Cash provided by operating activities increased $100.0 million during fiscal 2008 as compared to fiscal
2007. The increase was due primarily to changes in merchandise inventories and other working capital items in
the ordinary course of business.
Cash flows from investing activities
During fiscal 2009, we had a cash outflow from investing activities of $109.4 million compared to a cash
outflow of $199.6 million in fiscal 2008. The change is due primarily to changes in the purchase/sale of
investment securities. Due to volatility in the financial markets and the liquidity issues surrounding our auction
rate securities, we did not purchase any investment securities during fiscal 2009 and only liquidated $44.9
million of investment securities. During fiscal 2008, we had a net cash outflow of $32.5 million related to
investment securities. See Note 2 to the Consolidated Financial Statements included in this Report for more
information on our auction rate securities.
26