Family Dollar 2009 Annual Report Download - page 30
Download and view the complete annual report
Please find page 30 of the 2009 Family Dollar annual report below. You can navigate through the pages in the report by either clicking on the pages listed below, or by using the keyword search tool below to find specific information within the annual report.-
 1
1 -
2
-
3
-
4
-
5
-
6
-
7
-
8
-
9
-
10
-
11
-
12
-
13
-
14
-
15
-
16
-
17
-
18
-
19
-
 20
20 -
 21
21 -
 22
22 -
 23
23 -
 24
24 -
 25
25 -
 26
26 -
 27
27 -
 28
28 -
 29
29 -
 30
30 -
 31
31 -
 32
32 -
 33
33 -
 34
34 -
 35
35 -
 36
36 -
 37
37 -
 38
38 -
 39
39 -
 40
40 -
41
-
42
-
43
-
44
-
45
-
46
-
47
-
48
-
49
-
50
-
51
-
52
-
53
-
54
-
55
-
56
-
57
-
58
-
59
-
60
-
61
-
62
-
63
-
64
-
65
-
66
-
67
-
68
-
69
-
70
-
71
-
72
-
73
-
74
-
75
-
76
 |
 |

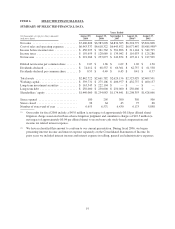
Results of Operations
Our results of operations for fiscal 2009, fiscal 2008 and fiscal 2007 are highlighted in the table below and
discussed in the following paragraphs:
Years Ended
(in thousands) August 29, 2009 August 30, 2008 September 1, 2007
Net sales ................................ $7,400,606 $6,983,628 $6,834,305
Cost and expenses:
Cost of sales ......................... 4,822,401 4,637,826 4,512,242
% of net sales .................... 65.2% 66.4% 66.0%
Selling, general and administrative ....... 2,120,936 1,980,496 1,933,430
% of net sales .................... 28.7% 28.4% 28.3%
Cost of sales and operating expenses .......... 6,943,337 6,618,322 6,445,672
% of net sales ........................ 93.8% 94.8% 94.3%
Operating profit .......................... 457,269 365,306 388,633
% of net sales ........................ 6.2% 5.2% 5.7%
Interest income ........................... 6,595 11,042 10,690
% of net sales ........................ 0.1% 0.2% 0.2%
Interest expense .......................... 12,939 14,586 17,427
% of net sales ........................ 0.2% 0.2% 0.3%
Income before income taxes ................. 450,925 361,762 381,896
% of net sales ........................ 6.1% 5.2% 5.6%
Income taxes ............................. 159,659 128,689 139,042
% of net sales ........................ 2.2% 1.8% 2.0%
Net Income .............................. 291,266 233,073 242,854
% of net sales ........................ 3.9% 3.3% 3.6%
Net Sales
Net sales increased 6.0% in fiscal 2009 compared to fiscal 2008 and 2.2% in fiscal 2008 compared to fiscal
2007. The increases in fiscal 2009 and fiscal 2008 were attributable, in part, to increases in comparable store
sales of 4.0% and 1.2%, respectively, with the balance of the increases primarily relating to sales from new stores
opened as part of our store growth program. Comparable store sales includes stores that have been open more
than 13 months. Stores that have been renovated, relocated, or expanded are included in the comparable store
sales calculation to the extent that they had sales during comparable weeks in each year. The method of
calculating comparable store sales varies across the retail industry. As a result, our comparable store sales
calculation may not be comparable to similarly titled measures reported by other companies.
Net sales in fiscal 2008 as compared to fiscal 2007, were negatively impacted by the loss of one week
during the reporting period. Fiscal 2008 was a 52-week year compared to a 53-week year in fiscal 2007. The
additional week was approximately 2% of net sales in fiscal 2007.
The 4.0% increase in comparable store sales in fiscal 2009 resulted from an increase in customer traffic, as
measured by the number of register transactions in comparable stores and an increase in the dollar value of the
average customer transaction. During fiscal 2009, the customer count increased approximately 2.8% and the
average customer transaction increased approximately 1.2% to $9.84 compared to fiscal 2008. Sales during fiscal
2009, on a comparable store basis, were strongest in Consumables, driven primarily by sales of food. Sales in
more discretionary categories continued to be soft, reflecting the current economic environment.
22