Energizer 2000 Annual Report Download - page 47
Download and view the complete annual report
Please find page 47 of the 2000 Energizer annual report below. You can navigate through the pages in the report by either clicking on the pages listed below, or by using the keyword search tool below to find specific information within the annual report.-
 1
1 -
2
-
3
-
4
-
5
-
6
-
7
-
8
-
9
-
10
-
11
-
12
-
13
-
14
-
15
-
16
-
17
-
18
-
19
-
20
-
21
-
22
-
23
-
24
-
25
-
26
-
27
-
28
-
29
-
30
-
31
-
32
-
33
-
34
-
35
-
36
-
 37
37 -
 38
38 -
 39
39 -
 40
40 -
 41
41 -
 42
42 -
 43
43 -
 44
44 -
 45
45 -
 46
46 -
 47
47 -
 48
48 -
 49
49 -
 50
50 -
 51
51 -
 52
52
 |
 |

45
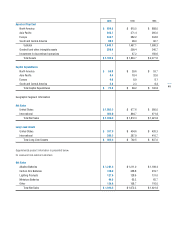
2000 1999 1998
Assets at Year End
North America $ 956.5 $ 815.5 $ 888.0
Asia Pacific 245.7 271.4 265.0
Europe 244.7 282.2 334.6
South and Central America 96.2 98.0 92.7
Subtotal 1,543.1 1,467.1 1,580.3
Goodwill and other intangible assets 250.4 299.4 340.7
Investment in discontinued operations –67.2 156.6
Total Assets $ 1,793.5 $ 1,833.7 $ 2,077.6
Capital Expenditures
North America $ 56.0 $ 39.6 $ 53.7
Asia Pacific 8.4 18.4 32.6
Europe 6.0 8.9 8.1
South and Central America 2.4 2.3 8.4
Total Capital Expenditures $ 72.8 $ 69.2 $ 102.8
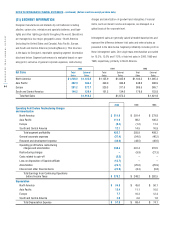
Geographic Segment Information
Net Sales
United States $ 1,052.3 $ 977.6 $ 950.0
International 862.0 894.7 971.8
Total Net Sales $ 1,914.3 $ 1,872.3 $ 1,921.8
Long Lived Assets
United States $ 517.9 $ 404.6 $ 426.3
International 345.3 387.9 410.7
Total Long Lived Assets $ 863.2 $ 792.5 $ 837.0
Supplemental product information is presented below
for revenues from external customers.
Net Sales
Alkaline Batteries $ 1,281.2 $ 1,211.0 $ 1,189.4
Carbon Zinc Batteries 316.4 358.8 419.7
Lighting Products 127.6 128.6 131.0
Miniature Batteries 64.5 65.2 65.7
Other 124.6 108.7 116.0
Total Net Sales $ 1,914.3 $ 1,872.3 $ 1,921.8