Energizer 2000 Annual Report Download - page 14
Download and view the complete annual report
Please find page 14 of the 2000 Energizer annual report below. You can navigate through the pages in the report by either clicking on the pages listed below, or by using the keyword search tool below to find specific information within the annual report.-
 1
1 -
2
-
3
-
 4
4 -
 5
5 -
 6
6 -
 7
7 -
 8
8 -
 9
9 -
 10
10 -
 11
11 -
 12
12 -
 13
13 -
 14
14 -
 15
15 -
 16
16 -
 17
17 -
 18
18 -
 19
19 -
 20
20 -
 21
21 -
 22
22 -
 23
23 -
 24
24 -
25
-
26
-
27
-
28
-
29
-
30
-
31
-
32
-
33
-
34
-
35
-
36
-
37
-
38
-
39
-
40
-
41
-
42
-
43
-
44
-
45
-
46
-
47
-
48
-
49
-
50
-
51
-
52
 |
 |

ENERGIZER 2000 ANNUAL REPORT
12
Selling, General and Administrative
Selling, general and administrative expenses decreased $19.3
or 5% in 2000 on lower general corporate expenses, as discussed
below, and decreases in Europe were partially offset by increases
in North American marketing and distribution costs. In 1999,
selling, general and administrative expenses were flat with 1998
as decreases in Europe and South and Central America were
offset by higher general corporate expenses. Selling, general and
administrative expenses were 19.7%, 21.2% and 20.7% of sales
in 2000, 1999 and 1998, respectively.
Advertising and Promotion
Advertising and promotion increased $23.1 or 14% in 2000 reflect-
ing higher spending in North America, partially offset by a decrease
in Europe. In 1999, advertising and promotion decreased $19.3 or
11% with declines in all regions. Advertising and promotion as a
percent of sales was 9.8%, 8.8% and 9.6% in 2000, 1999 and
1998, respectively.
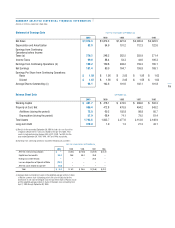
Segment Results
Energizer’s operations are managed via four major geographic
areas – North America (including the United States and Canada),
Asia Pacific, Europe and South and Central America (including
Mexico). This structure is the basis for Energizer’s reportable operat-
ing segment information presented in Note 21 to the Consolidated
Financial Statements. Energizer evaluates segment profitability based
on operating profit before general corporate expenses, research and
development expenses, restructuring charges and amortization of
goodwill and intangibles. Intersegment sales are generally valued
at market-based prices and represent the difference between total
sales and external sales as presented in Note 21 to the Consolidated
Financial Statements. Segment profitability includes profit on these
intersegment sales.
North America
Net sales increased $86.1 or 8% in 2000 on
higher volume, partially offset by unfavorable pricing and product
mix. Alkaline unit volume increased 11% over 1999. Strong Y2K-
driven demand early in the fiscal year and incremental Energizer e 2
sales in the last four months of the year account for the increased
volume. Gross margin increased $53.7 with volume contributing
$45.8. In addition, favorable production costs were partially offset
by unfavorable pricing and product mix. Segment profit increased
$20.5 or 7% as higher gross margin was partially offset by
increased advertising and promotion of $27.6, primarily related
to the Energizer e 2launch, as well as higher marketing and
distribution expenses.
Net sales increased $30.5 or 3% in 1999. Volume contributed
$55.2 of the sales increase, partially offset by unfavorable pricing
and product mix. Alkaline volume increased 8% in 1999. Segment
profit for North America increased $11.6 or 4% in 1999 as a result
of the higher gross margin associated with the increase in sales.
Increased marketing and distribution costs of $5.0 and increased
general and administrative expenses of $4.4 were largely offset by
an $8.4 decrease in advertising and promotion expenditures.
Asia Pacific
Net sales to customers increased $8.4 or 2% in
2000. Excluding currency devaluations of $4.3, net sales increased
$12.7 or 3%. Alkaline volume increases of 8% were partially offset
by a 2% decline in carbon zinc volume. Segment profit for Asia
Pacific increased $22.7 or 25%, in 2000. Gross margin increased
$23.3 due to lower production costs, higher customer sales and
higher intersegment sales. Lower production costs reflect a variety
of factors including higher production facility utilization and lower
costs resulting from a plant closing in 1999. Selling, general and
administrative expenses were up 1% compared to 1999.
Net sales decreased $12.1 or 3% in 1999. Currency devaluations
accounted for $12.0 of the sales decline. Carbon zinc volume
decreases of 5% were offset by a 4% increase in alkaline volume.
Segment profit for Asia Pacific decreased $11.1 or 11% in 1999.
Gross margin declined $21.3 due to higher production costs
and lower sales. Partially offsetting these declines were a $6.2
decrease in exchange losses and a $4.0 decrease in advertising
and promotion.
Europe
Net sales to customers for Europe decreased $44.3 or 14%
in 2000 reflecting currency devaluation of $28.2, lower carbon zinc
volume of $11.8 and unfavorable pricing and product mix of $6.9,
partially offset by a 1% alkaline volume gain. For the year, carbon
zinc unit volume declined 14%. Gross margin decreased $21.0,
primarily on unfavorable currency impacts of $18.3. The remaining
decline reflects lower sales, partially offset by lower production costs
associated with increased efficiencies following a plant closing in