Energizer 2000 Annual Report Download - page 45
Download and view the complete annual report
Please find page 45 of the 2000 Energizer annual report below. You can navigate through the pages in the report by either clicking on the pages listed below, or by using the keyword search tool below to find specific information within the annual report.-
 1
1 -
2
-
3
-
4
-
5
-
6
-
7
-
8
-
9
-
10
-
11
-
12
-
13
-
14
-
15
-
16
-
17
-
18
-
19
-
20
-
21
-
22
-
23
-
24
-
25
-
26
-
27
-
28
-
29
-
30
-
31
-
32
-
33
-
34
-
 35
35 -
 36
36 -
 37
37 -
 38
38 -
 39
39 -
 40
40 -
 41
41 -
 42
42 -
 43
43 -
 44
44 -
 45
45 -
 46
46 -
 47
47 -
 48
48 -
 49
49 -
 50
50 -
 51
51 -
 52
52
 |
 |

43
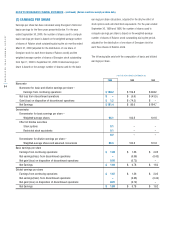
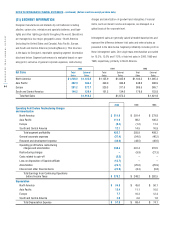
(18) SUPPLEMENTAL BALANCE SHEET INFORMATION
2000 1999
Inventories
Raw materials and supplies $ 64.0 $ 74.0
Work in process 87.0 80.5
Finished products 308.1 228.5
Total Inventories $ 459.1 $ 383.0
Other Current Assets
Investment in SPE (see Note 12) $ 157.1 $ –
Miscellaneous receivables 36.6 52.7
Deferred income tax benefits 38.9 34.6
Prepaid expenses 44.1 32.4
Other 2.0 1.6
Total Other Current Assets $ 278.7 $ 121.3
Investments and Other Assets
Goodwill (net of accumulated amortization:
2000 – $117.0; 1999 – $120.2) $ 168.0 $ 205.0
Other intangible assets (net of accumulated
amortization: 2000 – $356.1; 1999 – $343.3) 82.4 94.4
Pension asset 102.0 –
Deferred charges and other assets 25.4 20.3
Total Investments and Other Assets $ 377.8 $ 319.7
Other Current Liabilities
Accrued advertising, promotion and allowances $ 123.2 $ 110.0
Restructuring reserves 3.9 11.3
Salaries, vacations and incentive compensation 47.4 48.9
Other 74.1 78.3
Total Other Current Liabilities $ 248.6 $ 248.5
Other Non-current Liabilities
Postretirement benefit liability $ 87.7 $ –
Other non-current liability 69.0 23.0
Total Other Non-current Liabilities $ 156.7 $ 23.0
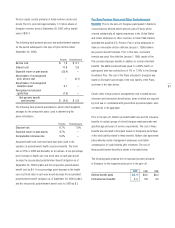
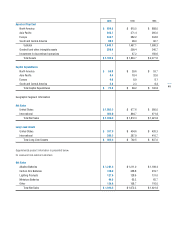
(19) SUPPLEMENTAL CASH FLOW STATEMENT INFORMATION
2000 1999 1998
Interest paid $ 19.5 $ 11.7 $ 14.9
Income taxes paid 86.5 44.0 81.2
(20) ALLOWANCE FOR DOUBTFUL ACCOUNTS
2000 1999 1998
Balance at beginning of year $ 19.3 $ 19.6 $ 19.6
Provision charged to expense 5.1 6.7 3.4
Write-offs, less recoveries (5.9) (7.0) (3.4)
Transfer to SPE (see Note 12) (6.0) ––
Balance at end of year $ 12.5 $ 19.3 $ 19.6