Energizer 2000 Annual Report Download - page 15
Download and view the complete annual report
Please find page 15 of the 2000 Energizer annual report below. You can navigate through the pages in the report by either clicking on the pages listed below, or by using the keyword search tool below to find specific information within the annual report.-
 1
1 -
2
-
3
-
4
-
 5
5 -
 6
6 -
 7
7 -
 8
8 -
 9
9 -
 10
10 -
 11
11 -
 12
12 -
 13
13 -
 14
14 -
 15
15 -
 16
16 -
 17
17 -
 18
18 -
 19
19 -
 20
20 -
 21
21 -
 22
22 -
 23
23 -
 24
24 -
 25
25 -
26
-
27
-
28
-
29
-
30
-
31
-
32
-
33
-
34
-
35
-
36
-
37
-
38
-
39
-
40
-
41
-
42
-
43
-
44
-
45
-
46
-
47
-
48
-
49
-
50
-
51
-
52
 |
 |

13
1999. Segment results for Europe improved $1.0 to a loss of $.2.
Net currency impacts in 2000 were unfavorable $6.8 compared
to 1999. Absent currency impacts, segment results improved $7.8
despite a $2.6 decrease in gross margin. The improvement reflects
lower costs following sales and administrative realignment last year.
Net sales to customers decreased $48.7 or 13% in 1999 compared
to 1998 primarily on lower volume. Alkaline and carbon zinc vol-
umes declined 5% and 19%, respectively, accounting for $33.3
of the sales decline. Pricing and product mix negatively impacted
sales by $17.0 in 1999. The majority of the pricing and product mix
decline, $9.8, was driven by Energizer’s move from a sales force to a
distributor model in several countries during 1999. The remainder of
the decline reflects competitive and retail pressures. Segment results
for Europe declined by $12.5 to a loss of $1.2 in 1999. Production
inefficiencies related to a plant closing and other costs associated
with restructuring activities accounted for $6.5 of the decline.
Excluding these costs, segment profit declined $6.0 as sales
declines of $48.7 were partially offset by a $28.3 decrease in cost
of products sold associated with the lower sales and a $15.1
decrease in overhead reflecting results of the restructuring of the
European business operations, including the move to the distributor
sales model in several countries.
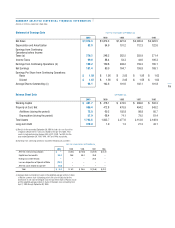
South and Central America
Net sales decreased $8.2 or 6%
in 2000, primarily on lower volume and on currency devaluation
which could not be mitigated through pricing actions. Carbon zinc
volume declined 6% while alkaline increased 1%. Despite the sales
decrease, gross margin increased $1.2 or 2%, as unfavorable
currency impacts of $7.2 were more than offset by lower production
costs, favorable pricing and product mix. Segment profit for South
and Central America decreased $2.4 or 17% in 2000 as higher
marketing, distribution and management costs were partially offset
by the gross margin increase.
Net sales decreased $19.2 or 13% in 1999 compared to 1998.
Of this decline, $19.0 was due to currency devaluation. Favorable
pricing and product mix of $16.0 was offset by volume declines
of 10% for alkaline and 17% for carbon zinc batteries.
Segment profit for South and Central America decreased $2.4 or
14% in 1999. Gross margin declined $13.0, much of which was
attributable to lower usage of production capacity in the Mexican
plant. Lower other operating costs and a decrease of $2.1 in
exchange losses partially offset the earnings decline. Operating cost
reductions included decreased advertising and promotion expenses
of $4.7 and lower general and administrative expenses of $2.4
resulting from actions taken to offset lower plant utilization and
from planned reorganization and restructuring in Brazil.
General Corporate Expenses
General corporate expenses decreased $16.6 in 2000 to $37.4,
compared to $54.0 in 1999, due to higher pension income and
lower consulting, reorganization and information systems costs as
well as a lighting product recall charge in 1999. These costs were
partially offset by additional costs associated with operating as a
stand-alone company for the last six months of fiscal 2000. Fiscal
2001 will include a full year of stand-alone costs, an estimated
increase of $4.0. Corporate expenses in 1999 increased $7.8 com-
pared to 1998 due to higher consulting costs, the product recall
charge discussed above and increases in various other corporate
costs. As a percent of sales, general corporate expenses were 2.0%
in 2000 compared to 2.9% in 1999 and 2.4% in 1998.
Research and Development Expense
Research and development expense of $49.9 in 2000 increased
3% in 2000, 4% in 1999 and 11% in 1998. These increases are
attributable to Energizer’s ongoing effort to maintain technological
leadership in the primary battery business. As a percent of sales,
research and development expense was 2.6% in 2000 and 1999
compared to 2.4% in 1998.
Costs Related to Spin-off
Energizer recorded one-time spin-related costs of $5.5 pre-tax, or
$3.3 after-tax. These costs include legal fees, charges related to the
vesting of certain compensation benefits and other costs triggered
by or associated with the spin-off.
Loss on Disposition of Spanish Affiliate
Energizer recorded a $15.7 pre-tax loss on the sale of its Spanish
affiliate prior to the spin-off. The loss was a non-cash write-off of
goodwill and cumulative translation accounts of the Spanish affiliate.
Ralston recognized capital loss tax benefits related to the Spanish