Energizer 2000 Annual Report Download - page 13
Download and view the complete annual report
Please find page 13 of the 2000 Energizer annual report below. You can navigate through the pages in the report by either clicking on the pages listed below, or by using the keyword search tool below to find specific information within the annual report.-
 1
1 -
2
-
 3
3 -
 4
4 -
 5
5 -
 6
6 -
 7
7 -
 8
8 -
 9
9 -
 10
10 -
 11
11 -
 12
12 -
 13
13 -
 14
14 -
 15
15 -
 16
16 -
 17
17 -
 18
18 -
 19
19 -
 20
20 -
 21
21 -
 22
22 -
 23
23 -
24
-
25
-
26
-
27
-
28
-
29
-
30
-
31
-
32
-
33
-
34
-
35
-
36
-
37
-
38
-
39
-
40
-
41
-
42
-
43
-
44
-
45
-
46
-
47
-
48
-
49
-
50
-
51
-
52
 |
 |

11
2001 relative to the same quarter last year. In addition, retail inven-
tory levels at December 31, 1999, were above historical norms due
to Y2K-driven ordering which further increased Energizer’s sales in
the first quarter of fiscal 2000. As such, Energizer anticipates report-
ing significantly lower year over year sales for its first fiscal quarter
of 2001.
The Asia Pacific area experienced significant currency devaluations
and economic contraction in 1998 and early 1999, with more stable
trends emerging more recently in most markets. Changes in the
value of local currencies or economic contractions in this area
may continue to impact segment profitability. In particular, recent
currency declines in Australia, New Zealand and the Philippines
have been unfavorable to Energizer during 2000 and into 2001. The
euro and certain other European currencies are at or near historical
low points relative to the U.S. dollar. Currency devaluation was a
significant unfavorable factor in 2000 and continues into 2001.
HIGHLIGHTS
Net earnings were $181.4 for the year ended September 30, 2000,
compared to $80.0 in 1999. Earnings per share were $1.89 and
$1.88 on a basic and diluted basis, respectively, compared to
earnings per basic and diluted share of $.78 in the prior year.
Included in net earnings are earnings from continuing operations
of $180.2 and $159.8 in 2000 and 1999, respectively. Current
year net earnings include a net gain on disposition of discontinued
operations of $1.2 related to the final settlement of the sale of
discontinued operations. Fiscal 1999 results include a net loss from
discontinued operations of $5.6 and a net loss on the disposition of
discontinued operations of $74.2.
Net earnings were $164.7, or $1.62 per basic and diluted share, for
the year ended September 30, 1998. Included in 1998 net earnings
are earnings from continuing operations of $208.2 and a net loss
from discontinued operations of $43.5.
Earnings from continuing operations increased $20.4, or $.32 and
$.31 per basic and diluted share, respectively, in 2000. Included in
2000 results are costs related to the spin-off of $5.5 pretax, $3.3
after-tax, loss on disposition of Spanish affiliate of $15.7, and capi-
tal loss tax benefits of $24.4. Fiscal 1999 results include provisions
for restructuring of $9.9 pretax, $8.3 after-tax, and capital loss tax
benefits of $16.6. Excluding these items, earnings from continuing
operations increased $23.3, or $.35 and $.34 per basic and diluted
share, respectively, in 2000. This increase is primarily attributable
to improved operating results in North America and Asia Pacific and
lower corporate overhead, partially offset by higher interest expense
on the debt assumed as part of the spin-off from Ralston.
Earnings from continuing operations decreased $48.4, or $.49
per basic and diluted share, in 1999. Included in both periods are
provisions for restructuring and capital loss tax benefits. Excluding
these items, earnings from continuing operations decreased $21.1,
or $.22 per basic and diluted share, in 1999. This decrease is pri-
marily attributable to declines in the Europe and Asia Pacific areas
partially offset by increases in North America.
Discontinued operations consist of Energizer’s worldwide recharge-
able Original Equipment Manufacturers’ (OEM) battery business.
In March 1999, the Board of Directors of Ralston announced its
intention to exit this business to allow Energizer to focus on its
primary battery business. On November 1, 1999, this business
was sold to Moltech Corporation for approximately $20.0.
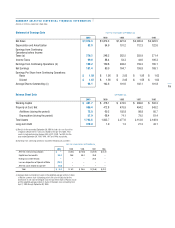
OPERATING RESULTS
Net Sales
Net sales increased $42.0 or 2% in 2000 compared to 1999
primarily on growth in North America, partially offset by declines
in Europe. In 1999, sales decreased $49.5 or 3% as declines in
Europe and, to a lesser extent, the Asia Pacific and South and
Central America regions were partially offset by increases in North
America. See comments on sales changes by region in the Segment
Results section below.
Gross Margin
Gross margin dollars increased $65.2 or 7% in 2000 on increases
in North America and Asia Pacific, partially offset by declines in
Europe. Gross margin percentage improved 2.4 percentage points
in 2000 to 49.1% on higher volume and lower production costs in
North America and Asia as well as lower costs in South and Central
America. Gross margin dollars declined $43.0 or 5% in 1999 on
lower sales and lower margin percentage. The margin percentage in
1999 was off 1.0 percentage point to 46.7% compared to 1998 with
decreases in all regions except North America.