Energizer 2000 Annual Report Download - page 33
Download and view the complete annual report
Please find page 33 of the 2000 Energizer annual report below. You can navigate through the pages in the report by either clicking on the pages listed below, or by using the keyword search tool below to find specific information within the annual report.-
 1
1 -
2
-
3
-
4
-
5
-
6
-
7
-
8
-
9
-
10
-
11
-
12
-
13
-
14
-
15
-
16
-
17
-
18
-
19
-
20
-
21
-
22
-
 23
23 -
 24
24 -
 25
25 -
 26
26 -
 27
27 -
 28
28 -
 29
29 -
 30
30 -
 31
31 -
 32
32 -
 33
33 -
 34
34 -
 35
35 -
 36
36 -
 37
37 -
 38
38 -
 39
39 -
 40
40 -
 41
41 -
 42
42 -
 43
43 -
44
-
45
-
46
-
47
-
48
-
49
-
50
-
51
-
52
 |
 |

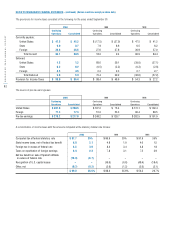
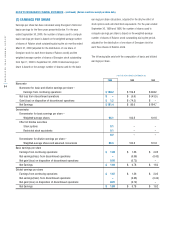
31
1998 Rollforward 1999 Rollforward 2000 Rollforward
Beginning Provision/ Ending Beginning Provision/ Ending Beginning Provision/ Ending
Balance Reversals Activity Balance Balance Reversals Activity Balance Balance Reversals Activity Balance
1994 Plan
Termination benefits 0.2 –(0.2) ––––– ––––
Other cash costs 1.2 –(1.2) ––––– ––––
Fixed asset impairments –(5.8) 5.8 ––(2.0) 2.0 –––––
Total 1.4 (5.8) 4.4 ––(2.0) 2.0 –––––
1995 Plan
Termination benefits 2.1 0.3 (1.5) 0.9 0.9 0.1 (1.0) –––––
Other cash costs 1.9 0.5 (1.2) 1.2 1.2 – (0.4) 0.8 0.8 – (0.8) –
Fixed asset impairments –(2.2) 2.2 ––(1.5) 1.5 –––––
Other non-cash charges –(0.4) 0.4 ––––– ––––
Total 4.0 (1.8) (0.1) 2.1 2.1 (1.4) 0.1 0.8 0.8 –(0.8) –
1996 Plan
Termination benefits 1.1 (0.6) (0.5) ––––– ––––
Other cash costs 1.7 – (0.7) 1.0 1.0 – (0.2) 0.8 0.8 ––0.8
Fixed asset impairments –(1.4) 1.4 ––––– ––––
Total 2.8 (2.0) 0.2 1.0 1.0 – (0.2) 0.8 0.8 ––0.8
1997 Plan
Termination benefits 42.6 (8.5) (15.4) 18.7 18.7 5.5 (20.1) 4.1 4.1 –(4.1) –
Other cash costs 2.2 2.3 (2.3) 2.2 2.2 1.8 (2.7) 1.3 1.3 ––1.3
Fixed asset impairments –––– –(1.9) 1.9 –––––
Other non-cash charges –0.6 (0.6) ––(2.4) 2.4 –––––
Total 44.8 (5.6) (18.3) 20.9 20.9 3.0 (18.5) 5.4 5.4 –(4.1) 1.3
1998 Plan
Termination benefits – 29.3 (15.0) 14.3 14.3 0.8 (13.5) 1.6 1.6 – (1.6) –
Other cash costs – 4.6 (1.9) 2.7 2.7 0.5 (1.2) 2.0 2.0 – (0.2) 1.8
Fixed asset impairments –1.1 (1.1) ––––– ––––
Other non-cash charges –1.5 (1.5) ––1.6 (1.6) –––––
Total – 36.5 (19.5) 17.0 17.0 2.9 (16.3) 3.6 3.6 – (1.8) 1.8
1999 Plan
Termination benefits –––– –3.2 (2.5) 0.7 0.7 – (0.7) –
Other cash costs –––– –0.2 (0.2) –––––
Fixed asset impairments –––– –4.0 (4.0) –––––
Total –––– –7.4 (6.7) 0.7 0.7 – (0.7) –
Grand Total $53.0 $21.3 $(33.3) $41.0 $41.0 $9.9 $(39.6) $11.3 $11.3 $ – $(7.4) $3.9
The following table presents, by major cost component and by year
of provision, activity related to the restructuring charges discussed
above during fiscal years 2000, 1999 and 1998, including any
adjustments to the original charges.
(6) INCOME TAX
Prior to the spin-off, U.S. income tax payments, refunds, credits,
provision and deferred tax components have been allocated to
Energizer in accordance with Ralston’s tax allocation policy. Such
policy allocates tax components included in the consolidated
income tax return of Ralston to Energizer to the extent such compo-
nents were generated by or related to Energizer. Subsequent to the
spin-off, taxes are provided on a stand-alone basis.
Had the Energizer tax provision been calculated as if Energizer was
a separate, independent U.S. taxpayer, the income tax provision
would have been higher by approximately $23.4 in 2000. The higher
provision is due primarily to the $24.4 of capital loss benefits that
would not be realized on a stand-alone basis.