Dish Network 2014 Annual Report Download - page 79
Download and view the complete annual report
Please find page 79 of the 2014 Dish Network annual report below. You can navigate through the pages in the report by either clicking on the pages listed below, or by using the keyword search tool below to find specific information within the annual report.-
 1
1 -
2
-
3
-
4
-
5
-
6
-
7
-
8
-
9
-
10
-
11
-
12
-
13
-
14
-
15
-
16
-
17
-
18
-
19
-
20
-
21
-
22
-
23
-
24
-
25
-
26
-
27
-
28
-
29
-
30
-
31
-
32
-
33
-
34
-
35
-
36
-
37
-
38
-
39
-
40
-
41
-
42
-
43
-
44
-
45
-
46
-
47
-
48
-
49
-
50
-
51
-
52
-
53
-
54
-
55
-
56
-
57
-
58
-
59
-
60
-
61
-
62
-
63
-
64
-
65
-
66
-
67
-
68
-
 69
69 -
 70
70 -
 71
71 -
 72
72 -
 73
73 -
 74
74 -
 75
75 -
 76
76 -
 77
77 -
 78
78 -
 79
79 -
 80
80 -
 81
81 -
 82
82 -
 83
83 -
 84
84 -
 85
85 -
 86
86 -
 87
87 -
 88
88 -
 89
89 -
90
-
91
-
92
-
93
-
94
-
95
-
96
-
97
-
98
-
99
-
100
-
101
-
102
-
103
-
104
-
105
-
106
-
107
-
108
-
109
-
110
-
111
-
112
-
113
-
114
-
115
-
116
-
117
-
118
-
119
-
120
-
121
-
122
-
123
-
124
-
125
-
126
-
127
-
128
-
129
-
130
-
131
-
132
-
133
-
134
-
135
-
136
-
137
-
138
-
139
-
140
-
141
-
142
-
143
-
144
-
145
-
146
-
147
-
148
-
149
-
150
-
151
-
152
-
153
-
154
-
155
-
156
-
157
-
158
-
159
-
160
-
161
-
162
-
163
-
164
-
165
-
166
-
167
-
168
-
169
-
170
-
171
-
172
-
173
-
174
-
175
-
176
-
177
-
178
-
179
-
180
-
181
-
182
-
183
-
184
-
185
-
186
-
187
-
188
 |
 |

Item 7. MANAGEMENT’S DISCUSSION AND ANALYSIS OF FINANCIAL CONDITION AND
RESULTS OF OPERATIONS - Continued
69
69
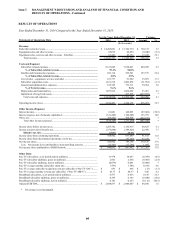
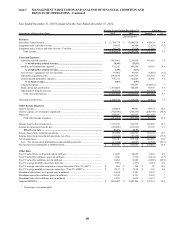
Year Ended December 31, 2013 Compared to the Year Ended December 31, 2012.
For the Years Ended December 31, Variance
Statements of Operations Data 2013 2012 Amount %
Revenue:
Subscriber-related revenue................................................................................................. 13,764,774$ 13,064,936$ 699,838$ 5.4
Equipment sales and other revenue..................................................................................... 94,855 98,480 (3,625) (3.7)
Equipment sales, services and other revenue - EchoStar.................................................... 45,236 17,918 27,318 *
Total revenue............................................................................................................... 13,904,865 13,181,334 723,531 5.5
Costs and Expenses:
Subscriber-related expenses............................................................................................. 7,818,061 7,254,458 563,603 7.8
% of Subscriber-related revenue........................................................................... 56.8% 55.5%
Satellite and transmission expenses................................................................................. 535,541 466,240 69,301 14.9
% of Subscriber-related revenue........................................................................... 3.9% 3.6%
Cost of sales - equipment, services and other ................................................................. 91,902 97,965 (6,063) (6.2)
Subscriber acquisition costs............................................................................................. 1,842,870 1,687,327 155,543 9.2
General and administrative expenses............................................................................... 776,711 722,045 54,666 7.6
% of Total revenue................................................................................................. 5.6% 5.5%
Litigation expense............................................................................................................ - 730,457 (730,457) *
Depreciation and amortization......................................................................................... 1,054,026 964,484 89,542 9.3
Impairment of long-lived assets....................................................................................... 437,575 - 437,575 *
Total costs and expenses.............................................................................................. 12,556,686 11,922,976 633,710 5.3
Operating income (loss)...................................................................................................... 1,348,179 1,258,358 89,821 7.1
Other Income (Expense):
Interest income.................................................................................................................... 148,865 99,091 49,774 50.2
Interest expense, net of amounts capitalized....................................................................... (744,985) (536,236) (208,749) (38.9)
Other, net............................................................................................................................ 384,856 173,697 211,159 *
Total other income (expense)...................................................................................... (211,264) (263,448) 52,184 19.8
Income (loss) before income taxes...................................................................................... 1,136,915 994,910 142,005 14.3
Income tax (provision) benefit, net..................................................................................... (299,826) (331,991) 32,165 9.7
Effective tax rate....................................................................................................... 26.4% 33.4%
Income (loss) from continuing operations.......................................................................... 837,089 662,919 174,170 26.3
Income (loss) from discontinued operations, net of tax...................................................... (47,343) (37,179) (10,164) (27.3)
Net income (loss)................................................................................................................ 789,746 625,740 164,006 26.2
Less: Net income (loss) attributable to noncontrolling interests.................................... (17,746) (10,947) (6,799) (62.1)
Net income (loss) attributable to DISH Network................................................................ 807,492$ 636,687$ 170,805$ 26.8
Other Data:
Pay-TV subscribers, as of period end (in millions)............................................................. 14.057 14.056 0.001 0.0
Pay-TV subscriber additions, gross (in millions)................................................................ 2.666 2.739 (0.073) (2.7)
Pay-TV subscriber additions, net (in millions)................................................................... 0.001 0.089 (0.088) (98.9)
Pay-TV average monthly subscriber churn rate.................................................................. 1.58% 1.57% 0.01% 0.6
Pay-TV average subscriber acquisition cost per subscriber (“Pay-TV SAC”)................... 866$ 784$ 82$ 10.5
Pay-TV average monthly revenue per subscriber (“Pay-TV ARPU”)............................... 80.37$ 76.98$ 3.39$ 4.4
Broadband subscribers, as of period end (in millions)........................................................ 0.436 0.183 0.253 *
Broadband subscriber additions, gross (in millions)........................................................... 0.343 0.121 0.222 *
Broadband subscriber additions, net (in millions).............................................................. 0.253 0.078 0.175 *
Adjusted EBITDA.............................................................................................................. 2,804,807$ 2,407,486$ 397,321$ 16.5
* Percentage is not meaningful.
(In thousands)