Dish Network 2014 Annual Report Download - page 67
Download and view the complete annual report
Please find page 67 of the 2014 Dish Network annual report below. You can navigate through the pages in the report by either clicking on the pages listed below, or by using the keyword search tool below to find specific information within the annual report.-
 1
1 -
2
-
3
-
4
-
5
-
6
-
7
-
8
-
9
-
10
-
11
-
12
-
13
-
14
-
15
-
16
-
17
-
18
-
19
-
20
-
21
-
22
-
23
-
24
-
25
-
26
-
27
-
28
-
29
-
30
-
31
-
32
-
33
-
34
-
35
-
36
-
37
-
38
-
39
-
40
-
41
-
42
-
43
-
44
-
45
-
46
-
47
-
48
-
49
-
50
-
51
-
52
-
53
-
54
-
55
-
56
-
 57
57 -
 58
58 -
 59
59 -
 60
60 -
 61
61 -
 62
62 -
 63
63 -
 64
64 -
 65
65 -
 66
66 -
 67
67 -
 68
68 -
 69
69 -
 70
70 -
 71
71 -
 72
72 -
 73
73 -
 74
74 -
 75
75 -
 76
76 -
 77
77 -
78
-
79
-
80
-
81
-
82
-
83
-
84
-
85
-
86
-
87
-
88
-
89
-
90
-
91
-
92
-
93
-
94
-
95
-
96
-
97
-
98
-
99
-
100
-
101
-
102
-
103
-
104
-
105
-
106
-
107
-
108
-
109
-
110
-
111
-
112
-
113
-
114
-
115
-
116
-
117
-
118
-
119
-
120
-
121
-
122
-
123
-
124
-
125
-
126
-
127
-
128
-
129
-
130
-
131
-
132
-
133
-
134
-
135
-
136
-
137
-
138
-
139
-
140
-
141
-
142
-
143
-
144
-
145
-
146
-
147
-
148
-
149
-
150
-
151
-
152
-
153
-
154
-
155
-
156
-
157
-
158
-
159
-
160
-
161
-
162
-
163
-
164
-
165
-
166
-
167
-
168
-
169
-
170
-
171
-
172
-
173
-
174
-
175
-
176
-
177
-
178
-
179
-
180
-
181
-
182
-
183
-
184
-
185
-
186
-
187
-
188
 |
 |
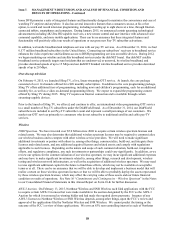
Item 7. MANAGEMENT’S DISCUSSION AND ANALYSIS OF FINANCIAL CONDITION AND
RESULTS OF OPERATIONS
57
57
You should read the following management’s discussion and analysis of our financial condition and results of
operations together with the audited consolidated financial statements and notes to our financial statements
included elsewhere in this Annual Report. This management’s discussion and analysis is intended to help provide
an understanding of our financial condition, changes in financial condition and results of our operations and
contains forward-looking statements that involve risks and uncertainties. The forward-looking statements are not
historical facts, but rather are based on current expectations, estimates, assumptions and projections about our
industry, business and future financial results. Our actual results could differ materially from the results
contemplated by these forward-looking statements due to a number of factors, including those discussed in this
report, including under the caption “Item 1A. Risk Factors” in this Annual Report on Form 10-K. Furthermore,
such forward-looking statements speak only as of the date of this Annual Report on Form 10-K and we expressly
disclaim any obligation to update any forward-looking statements.
Overview
Our business strategy is to be the best provider of video services in the United States by providing products with the
best technology, outstanding customer service, and great value. We promote DISH branded programming packages
as providing our subscribers with a better “price-to-value” relationship than those available from other subscription
television service providers. We believe that there continues to be unsatisfied demand for high-quality, reasonably
priced subscription television services.
We generate revenue primarily by providing pay-TV programming and broadband services to our subscribers. We also
generate revenue from pay-TV equipment rental fees and other hardware related fees, including fees for DVRs, fees
for broadband equipment, equipment upgrade fees and additional outlet fees from subscribers with receivers with
multiple tuners; advertising services; and fees earned from our in-home service operations. Our most significant
expenses are subscriber-related expenses, which are primarily related to programming, subscriber acquisition costs and
depreciation and amortization.
Financial Highlights
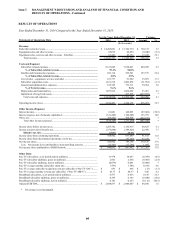
2014 Consolidated Results of Operations and Key Operating Metrics
Revenue of $14.643 billion
Pay-TV ARPU of $83.77
Net income attributable to DISH Network of $945 million and basic earnings per share of common stock of
$2.05
Gross new Pay-TV subscriber activations of approximately 2.601 million
Loss of approximately 79,000 net Pay-TV subscribers
Pay-TV subscriber churn rate of 1.59%
Addition of approximately 141,000 net broadband subscribers
Consolidated Financial Condition as of December 31, 2014
Cash, cash equivalents and current marketable investment securities of $9.236 billion
Total assets of $22.107 billion
Total long-term debt and capital lease obligations of $14.464 billion
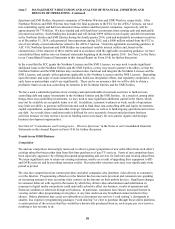
Business Segments
DISH
Our DISH branded pay-TV service (“DISH”) had 13.978 million subscribers in the United States as of December 31,
2014 and is the nation’s third largest pay-TV provider. The majority of our current revenue and profit is derived from
providing pay-TV services. Competition in the pay-TV industry has intensified in recent years. To differentiate
ourselves from our competitors, we introduced the Hopper whole-home DVR during 2012 and have continued to add
functionality and simplicity for a more intuitive user experience. Our current generation Hopper and Joey® whole-