Dish Network 2014 Annual Report Download - page 76
Download and view the complete annual report
Please find page 76 of the 2014 Dish Network annual report below. You can navigate through the pages in the report by either clicking on the pages listed below, or by using the keyword search tool below to find specific information within the annual report.-
 1
1 -
2
-
3
-
4
-
5
-
6
-
7
-
8
-
9
-
10
-
11
-
12
-
13
-
14
-
15
-
16
-
17
-
18
-
19
-
20
-
21
-
22
-
23
-
24
-
25
-
26
-
27
-
28
-
29
-
30
-
31
-
32
-
33
-
34
-
35
-
36
-
37
-
38
-
39
-
40
-
41
-
42
-
43
-
44
-
45
-
46
-
47
-
48
-
49
-
50
-
51
-
52
-
53
-
54
-
55
-
56
-
57
-
58
-
59
-
60
-
61
-
62
-
63
-
64
-
65
-
 66
66 -
 67
67 -
 68
68 -
 69
69 -
 70
70 -
 71
71 -
 72
72 -
 73
73 -
 74
74 -
 75
75 -
 76
76 -
 77
77 -
 78
78 -
 79
79 -
 80
80 -
 81
81 -
 82
82 -
 83
83 -
 84
84 -
 85
85 -
 86
86 -
87
-
88
-
89
-
90
-
91
-
92
-
93
-
94
-
95
-
96
-
97
-
98
-
99
-
100
-
101
-
102
-
103
-
104
-
105
-
106
-
107
-
108
-
109
-
110
-
111
-
112
-
113
-
114
-
115
-
116
-
117
-
118
-
119
-
120
-
121
-
122
-
123
-
124
-
125
-
126
-
127
-
128
-
129
-
130
-
131
-
132
-
133
-
134
-
135
-
136
-
137
-
138
-
139
-
140
-
141
-
142
-
143
-
144
-
145
-
146
-
147
-
148
-
149
-
150
-
151
-
152
-
153
-
154
-
155
-
156
-
157
-
158
-
159
-
160
-
161
-
162
-
163
-
164
-
165
-
166
-
167
-
168
-
169
-
170
-
171
-
172
-
173
-
174
-
175
-
176
-
177
-
178
-
179
-
180
-
181
-
182
-
183
-
184
-
185
-
186
-
187
-
188
 |
 |

Item 7. MANAGEMENT’S DISCUSSION AND ANALYSIS OF FINANCIAL CONDITION AND
RESULTS OF OPERATIONS - Continued
66
66
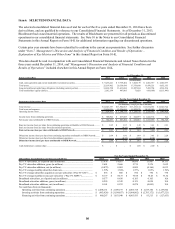
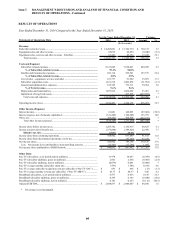
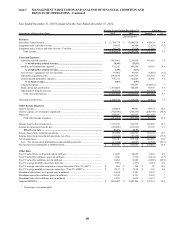
Subscriber-related revenue. “Subscriber-related revenue” totaled $14.495 billion for the year ended December 31,
2014, an increase of $730 million or 5.3% compared to the same period in 2013. The change in “Subscriber-related
revenue” from the same period in 2013 was primarily related to the increase in Pay-TV ARPU discussed below and
increased revenue from broadband services. Included in “Subscriber-related revenue” was $376 million and $221
million of revenue related to our broadband services for the years ended December 31, 2014 and 2013, respectively,
representing 2.6% and 1.6% of our total “Subscriber-related revenue,” respectively.
Pay-TV ARPU. Pay-TV ARPU was $83.77 during the year ended December 31, 2014 versus $80.37 during the same
period in 2013. The $3.40 or 4.2% increase in Pay-TV ARPU was primarily attributable to the programming package
price increases in February 2014 and 2013 and higher hardware related revenue, partially offset by a shift in
programming package mix.
Subscriber-related expenses. “Subscriber-related expenses” totaled $8.313 billion during the year ended December
31, 2014, an increase of $495 million or 6.3% compared to the same period in 2013. The increase in “Subscriber-
related expenses” was primarily attributable to higher pay-TV programming costs and higher Broadband subscriber-
related expenses due to the increase in our Broadband subscriber base, partially offset by a one-time reduction in
programming related expense. The increase in programming costs was driven by rate increases in certain of our
programming contracts, including the renewal of certain contracts at higher rates. Included in “Subscriber-related
expenses” was $242 million and $143 million of expense related to our broadband services for the years ended
December 31, 2014 and 2013, respectively. “Subscriber-related expenses” represented 57.4% and 56.8% of
“Subscriber-related revenue” during the years ended December 31, 2014 and 2013, respectively. The change in this
expense to revenue ratio primarily resulted from higher pay-TV programming costs, discussed above.
In the normal course of business, we enter into contracts to purchase programming content in which our payment
obligations are generally contingent on the number of Pay-TV subscribers to whom we provide the respective content.
Our “Subscriber-related expenses” have and may continue to face further upward pressure from price increases and the
renewal of long-term pay-TV programming contracts on less favorable pricing terms. In addition, our programming
expenses will continue to increase to the extent we are successful in growing our Pay-TV subscriber base.
Satellite and transmission expenses. “Satellite and transmission expenses” totaled $693 million during the year ended
December 31, 2014, an increase of $158 million or 29.4% compared to the same period in 2013. The increase in
“Satellite and transmission expenses” was primarily related to an increase in transponder capacity leased from
EchoStar as a result of the Satellite and Tracking Stock Transaction during the first quarter 2014. See Note 20 in the
Notes to our Consolidated Financial Statements in this Annual Report on Form 10-K for further discussion.
Subscriber acquisition costs. “Subscriber acquisition costs” totaled $1.811 billion for the year ended December 31,
2014, a decrease of $32 million or 1.7% compared to the same period in 2013. This change was primarily attributable
to a decrease in gross new Pay-TV subscriber activations and a decrease in expense related to our Broadband
subscriber activations. Included in “Subscriber acquisition costs” was $136 million and $154 million of expenses
related to our broadband services for the years ended December 31, 2014 and 2013, respectively.
Pay-TV SAC. Pay-TV SAC was $853 during the year ended December 31, 2014 compared to $866 during the same
period in 2013, a decrease of $13 or 1.5%. This change was primarily attributable to a decrease in hardware costs per
activation, partially offset by an increase in advertising costs. The decrease in hardware costs per activation was driven
by a reduction in manufacturing costs for next generation Hopper receiver systems and a higher percentage of
remanufactured receivers being activated on new subscriber accounts.
During the years ended December 31, 2014 and 2013, the amount of equipment capitalized under our lease program
for new Pay-TV subscribers totaled $543 million and $621 million, respectively. This decrease in capital expenditures
under our lease program for new Pay-TV subscribers primarily resulted from a decrease in hardware costs per
activation as discussed above and a decrease in gross new Pay-TV subscriber activations.
To remain competitive we upgrade or replace subscriber equipment periodically as technology changes, and the
costs associated with these upgrades may be substantial. To the extent technological changes render a portion of our
existing equipment obsolete, we would be unable to redeploy all returned equipment and consequently would realize
less benefit from the Pay-TV SAC reduction associated with redeployment of that returned lease equipment.