Dish Network 2014 Annual Report Download - page 151
Download and view the complete annual report
Please find page 151 of the 2014 Dish Network annual report below. You can navigate through the pages in the report by either clicking on the pages listed below, or by using the keyword search tool below to find specific information within the annual report.-
 1
1 -
2
-
3
-
4
-
5
-
6
-
7
-
8
-
9
-
10
-
11
-
12
-
13
-
14
-
15
-
16
-
17
-
18
-
19
-
20
-
21
-
22
-
23
-
24
-
25
-
26
-
27
-
28
-
29
-
30
-
31
-
32
-
33
-
34
-
35
-
36
-
37
-
38
-
39
-
40
-
41
-
42
-
43
-
44
-
45
-
46
-
47
-
48
-
49
-
50
-
51
-
52
-
53
-
54
-
55
-
56
-
57
-
58
-
59
-
60
-
61
-
62
-
63
-
64
-
65
-
66
-
67
-
68
-
69
-
70
-
71
-
72
-
73
-
74
-
75
-
76
-
77
-
78
-
79
-
80
-
81
-
82
-
83
-
84
-
85
-
86
-
87
-
88
-
89
-
90
-
91
-
92
-
93
-
94
-
95
-
96
-
97
-
98
-
99
-
100
-
101
-
102
-
103
-
104
-
105
-
106
-
107
-
108
-
109
-
110
-
111
-
112
-
113
-
114
-
115
-
116
-
117
-
118
-
119
-
120
-
121
-
122
-
123
-
124
-
125
-
126
-
127
-
128
-
129
-
130
-
131
-
132
-
133
-
134
-
135
-
136
-
137
-
138
-
139
-
140
-
 141
141 -
 142
142 -
 143
143 -
 144
144 -
 145
145 -
 146
146 -
 147
147 -
 148
148 -
 149
149 -
 150
150 -
 151
151 -
 152
152 -
 153
153 -
 154
154 -
 155
155 -
 156
156 -
 157
157 -
 158
158 -
 159
159 -
 160
160 -
 161
161 -
162
-
163
-
164
-
165
-
166
-
167
-
168
-
169
-
170
-
171
-
172
-
173
-
174
-
175
-
176
-
177
-
178
-
179
-
180
-
181
-
182
-
183
-
184
-
185
-
186
-
187
-
188
 |
 |

DISH NETWORK CORPORATION
NOTES TO CONSOLIDATED FINANCIAL STATEMENTS - Continued
F-45
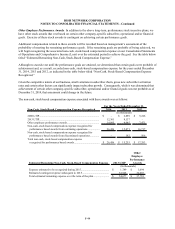
Of the 11.7 million stock options and 1.8 million restricted stock units outstanding under our stock incentive plans
as of December 31, 2014, the following awards were outstanding pursuant to our performance-based stock incentive
plans:
Performance Based Stock Options
Number of
Awards
Weighted-
Average
Grant Price
2005 LTIP (1).......................................................... 3,164,500 20.31$
2013 LTIP................................................................ 1,592,000 40.02$
Other employee performance awards....................... 2,490,000 18.85$
Total......................................................................... 7,246,500 24.14$
Restricted Performance Units
2005 LTIP (1).......................................................... 277,331
2013 LTIP................................................................ 796,000
Other employee performance awards....................... 725,000
Total......................................................................... 1,798,331
As of December 31, 2014
(1) It was determined that the goal can no longer be achieved under the terms of the 2005 LTIP.
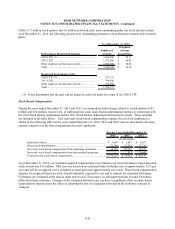
Stock-Based Compensation
During the years ended December 31, 2013 and 2012, we incurred an initial charge related to vested options of $5
million and $14 million, respectively, of additional non-cash, stock-based compensation expense in connection with
the 2012 Stock Option Adjustment and the 2011 Stock Option Adjustment discussed previously. These amounts
are included in the table below. Total non-cash, stock-based compensation expense for all of our employees is
shown in the following table for the years ended December 31, 2014, 2013 and 2012 and was allocated to the same
expense categories as the base compensation for such employees:
2014 2013 2012
Subscriber-related....................................................................................... 1,859$ 1,947$ 1,607$
General and administrative.......................................................................... 32,294 27,783 37,720
Non-cash, stock-based compensation from continuing operations.............. 34,153 29,730 39,327
Non-cash, stock-based compensation from discontinued operations.......... - 925 1,643
Total non-cash, stock-based compensation ................................................ 34,153$ 30,655$ 40,970$
For the Years Ended December 31,
(In thousands)
As of December 31, 2014, our total unrecognized compensation cost related to our non-performance based unvested
stock awards was $15 million. This cost was based on an estimated future forfeiture rate of approximately 3.2% per
year and will be recognized over a weighted-average period of approximately two years. Share-based compensation
expense is recognized based on stock awards ultimately expected to vest and is reduced for estimated forfeitures.
Forfeitures are estimated at the time of grant and revised, if necessary, in subsequent periods if actual forfeitures
differ from those estimates. Changes in the estimated forfeiture rate can have a significant effect on share-based
compensation expense since the effect of adjusting the rate is recognized in the period the forfeiture estimate is
changed.