Dish Network 2014 Annual Report Download - page 135
Download and view the complete annual report
Please find page 135 of the 2014 Dish Network annual report below. You can navigate through the pages in the report by either clicking on the pages listed below, or by using the keyword search tool below to find specific information within the annual report.-
 1
1 -
2
-
3
-
4
-
5
-
6
-
7
-
8
-
9
-
10
-
11
-
12
-
13
-
14
-
15
-
16
-
17
-
18
-
19
-
20
-
21
-
22
-
23
-
24
-
25
-
26
-
27
-
28
-
29
-
30
-
31
-
32
-
33
-
34
-
35
-
36
-
37
-
38
-
39
-
40
-
41
-
42
-
43
-
44
-
45
-
46
-
47
-
48
-
49
-
50
-
51
-
52
-
53
-
54
-
55
-
56
-
57
-
58
-
59
-
60
-
61
-
62
-
63
-
64
-
65
-
66
-
67
-
68
-
69
-
70
-
71
-
72
-
73
-
74
-
75
-
76
-
77
-
78
-
79
-
80
-
81
-
82
-
83
-
84
-
85
-
86
-
87
-
88
-
89
-
90
-
91
-
92
-
93
-
94
-
95
-
96
-
97
-
98
-
99
-
100
-
101
-
102
-
103
-
104
-
105
-
106
-
107
-
108
-
109
-
110
-
111
-
112
-
113
-
114
-
115
-
116
-
117
-
118
-
119
-
120
-
121
-
122
-
123
-
124
-
 125
125 -
 126
126 -
 127
127 -
 128
128 -
 129
129 -
 130
130 -
 131
131 -
 132
132 -
 133
133 -
 134
134 -
 135
135 -
 136
136 -
 137
137 -
 138
138 -
 139
139 -
 140
140 -
 141
141 -
 142
142 -
 143
143 -
 144
144 -
 145
145 -
146
-
147
-
148
-
149
-
150
-
151
-
152
-
153
-
154
-
155
-
156
-
157
-
158
-
159
-
160
-
161
-
162
-
163
-
164
-
165
-
166
-
167
-
168
-
169
-
170
-
171
-
172
-
173
-
174
-
175
-
176
-
177
-
178
-
179
-
180
-
181
-
182
-
183
-
184
-
185
-
186
-
187
-
188
 |
 |

DISH NETWORK CORPORATION
NOTES TO CONSOLIDATED FINANCIAL STATEMENTS - Continued
F-29
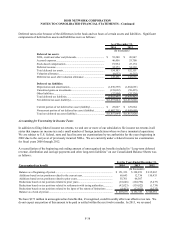
In the event of a failure or loss of any of our owned or leased satellites, we may need to acquire or lease additional
satellite capacity or relocate one of our other owned or leased satellites and use it as a replacement for the failed or
lost satellite. Such a failure could result in a prolonged loss of critical programming or a significant delay in our
plans to expand programming as necessary to remain competitive and thus may have a material adverse effect on
our business, financial condition and results of operations.
In the past, certain of our owned and leased satellites have experienced anomalies, some of which have had a
significant adverse impact on their remaining useful life and/or commercial operation. There can be no assurance
that future anomalies will not impact the remaining useful life and/or commercial operation of any of the owned and
leased satellites in our fleet. See Note 2 “Impairment of Long-Lived Assets” for further discussion of evaluation of
impairment. There can be no assurance that we can recover critical transmission capacity in the event one or more
of our owned or leased in-orbit satellites were to fail. We generally do not carry commercial insurance for any of
the owned or leased in-orbit satellites that we use, other than certain satellites leased from third parties, and
therefore, we will bear the risk associated with any uninsured in-orbit satellite failures.
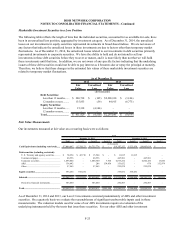
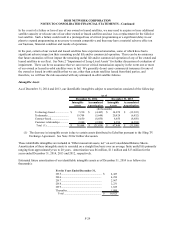
Intangible Assets
As of December 31, 2014 and 2013, our identifiable intangibles subject to amortization consisted of the following:
Intangible Accumulated Intangible Accumulated
Assets Amortization Assets Amortization
Technology-based..................... 7,210$ (4,445)$ 34,078$ (12,222)$
Trademarks............................... 19,704 (5,644) 20,424 (6,432)
Contract-based.......................... 8,650 (8,650) 8,650 (8,650)
Customer relationships............. 2,900 (2,900) 4,294 (4,294)
Total (1)................................. 38,464$ (21,639)$ 67,446$ (31,598)$
As of
December 31, 2014 December 31, 2013
(In thousands)
(1) The decrease in intangible assets is due to certain assets distributed to EchoStar pursuant to the Sling TV
Exchange Agreement. See Note 20 for further discussion.
These identifiable intangibles are included in “Other noncurrent assets, net” on our Consolidated Balance Sheets.
Amortization of these intangible assets is recorded on a straight line basis over an average finite useful life primarily
ranging from approximately two to 20 years. Amortization was $6 million, $11 million and $13 million for the
years ended December 31, 2014, 2013 and 2012, respectively.
Estimated future amortization of our identifiable intangible assets as of December 31, 2014 is as follows (in
thousands):
For the Years Ended December 31,
2015............................................................ 4,423$
2016............................................................ 4,299
2017............................................................ 2,967
2018............................................................ 2,231
2019............................................................ 1,825
Thereafter................................................... 1,080
Total ....................................................... 16,825$