Dish Network 2006 Annual Report Download - page 96
Download and view the complete annual report
Please find page 96 of the 2006 Dish Network annual report below. You can navigate through the pages in the report by either clicking on the pages listed below, or by using the keyword search tool below to find specific information within the annual report.-
 1
1 -
2
-
3
-
4
-
5
-
6
-
7
-
8
-
9
-
10
-
11
-
12
-
13
-
14
-
15
-
16
-
17
-
18
-
19
-
20
-
21
-
22
-
23
-
24
-
25
-
26
-
27
-
28
-
29
-
30
-
31
-
32
-
33
-
34
-
35
-
36
-
37
-
38
-
39
-
40
-
41
-
42
-
43
-
44
-
45
-
46
-
47
-
48
-
49
-
50
-
51
-
52
-
53
-
54
-
55
-
56
-
57
-
58
-
59
-
60
-
61
-
62
-
63
-
64
-
65
-
66
-
67
-
68
-
69
-
70
-
71
-
72
-
73
-
74
-
75
-
76
-
77
-
78
-
79
-
80
-
81
-
82
-
83
-
84
-
85
-
 86
86 -
 87
87 -
 88
88 -
 89
89 -
 90
90 -
 91
91 -
 92
92 -
 93
93 -
 94
94 -
 95
95 -
 96
96 -
 97
97 -
 98
98 -
 99
99 -
 100
100 -
 101
101 -
 102
102 -
 103
103 -
 104
104 -
 105
105 -
 106
106 -
107
-
108
-
109
-
110
-
111
-
112
-
113
-
114
-
115
-
116
-
117
-
118
-
119
-
120
-
121
-
122
-
123
-
124
-
125
-
126
-
127
-
128
-
129
-
130
-
131
-
132
 |
 |

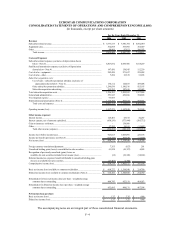
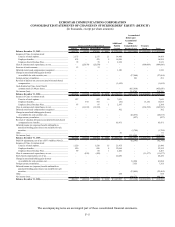
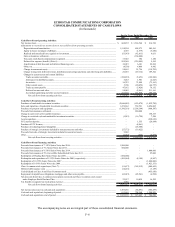
ECHOSTAR COMMUNICATIONS CORPORATION
NOTES TO CONSOLIDATED FINANCIAL STATEMENTS – Continued
F–11
Black-Scholes option pricing model. As of December 31, 2006 and 2005, the fair value of the convertible debt was
approximately $22.5 million and $42.3 million, respectively, based on the trading price of the issuer’s shares on that
date. During the second quarter of 2006, we converted a portion of the convertible debt to public common shares
and determined that we have the ability to significantly influence the operating decisions of the issuer.
Consequently, we account for the common share component of our investment under the equity method of
accounting. Additionally, during the years ended December 31, 2006 and 2005, we recognized a pre-tax unrealized
loss of approximately $14.9 million and a gain of $38.8 million for the change in the fair value of the convertible
debt, respectively. As of December 31, 2006, we have $59.1 million recorded as part of the total equity investment
in “Other non-current assets, net” for the amount by which the carrying value of our investment in the issuer’s
common stock exceeds the value of our portion of the underlying balance sheet equity of the investee. As a result of
our change from cost to equity method accounting, we evaluate the common share component on a quarterly basis to
determine whether declines in the fair value of this security are other than temporary. This quarterly evaluation is
similar to that used for marketable securities, as discussed above.
Our ability to realize value from our strategic investments in companies that are not publicly traded is dependent on the
success of their business and their ability to obtain sufficient capital to execute their business plans. Because private
markets are not as liquid as public markets, there is also increased risk that we will not be able to sell these investments,
or that when we desire to sell them we will not be able to obtain fair value for them.
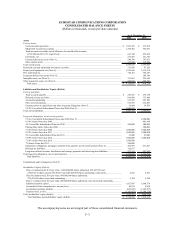
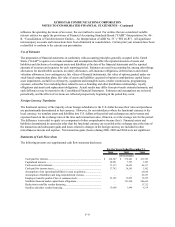
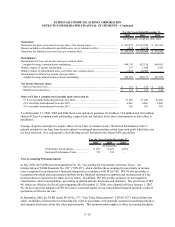
Restricted Cash and Marketable Investment Securities. As of December 31, 2006 and 2005, restricted cash and
marketable investment securities included amounts set aside as collateral for investments in marketable securities
and our letters of credit. Additionally, restricted cash and marketable investment securities as of December 31, 2006
included $101.3 million in escrow related to our litigation with Tivo.
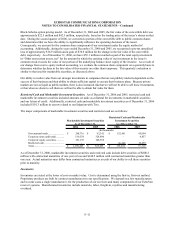
The major components of marketable investment securities and restricted cash are as follows:
Restricted Cash and Marketable
Marketable Investment Securities Investment Securities
As of December 31, As of December 31,
2006 2005 2006 2005
(In thousands)
Government bonds ........................ $ 268,716 $ 92,341 $ 152,461 45,804
Corporate notes and bonds ............ 519,554 324,800 - 4,857
Corporate equity securities ........... 321,195 148,550 - -
Restricted cash .............................. - - 20,480 16,459
Total............................................... 1,109,465$ 565,691$ 172,941$ 67,120
As of December 31, 2006, marketable investment securities and restricted cash include debt securities of $800.2
million with contractual maturities of one year or less and $140.5 million with contractual maturities greater than
one year. Actual maturities may differ from contractual maturities as a result of our ability to sell these securities
prior to maturity.
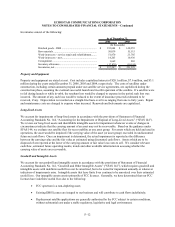
Inventories
Inventories are stated at the lower of cost or market value. Cost is determined using the first-in, first-out method.
Proprietary products are built by contract manufacturers to our specifications. We depend on a few manufacturers,
and in some cases a single manufacturer, for the production of our receivers and many components of our EchoStar
receiver systems. Manufactured inventories include materials, labor, freight-in, royalties and manufacturing
overhead.