Dish Network 2006 Annual Report Download - page 108
Download and view the complete annual report
Please find page 108 of the 2006 Dish Network annual report below. You can navigate through the pages in the report by either clicking on the pages listed below, or by using the keyword search tool below to find specific information within the annual report.-
 1
1 -
2
-
3
-
4
-
5
-
6
-
7
-
8
-
9
-
10
-
11
-
12
-
13
-
14
-
15
-
16
-
17
-
18
-
19
-
20
-
21
-
22
-
23
-
24
-
25
-
26
-
27
-
28
-
29
-
30
-
31
-
32
-
33
-
34
-
35
-
36
-
37
-
38
-
39
-
40
-
41
-
42
-
43
-
44
-
45
-
46
-
47
-
48
-
49
-
50
-
51
-
52
-
53
-
54
-
55
-
56
-
57
-
58
-
59
-
60
-
61
-
62
-
63
-
64
-
65
-
66
-
67
-
68
-
69
-
70
-
71
-
72
-
73
-
74
-
75
-
76
-
77
-
78
-
79
-
80
-
81
-
82
-
83
-
84
-
85
-
86
-
87
-
88
-
89
-
90
-
91
-
92
-
93
-
94
-
95
-
96
-
97
-
 98
98 -
 99
99 -
 100
100 -
 101
101 -
 102
102 -
 103
103 -
 104
104 -
 105
105 -
 106
106 -
 107
107 -
 108
108 -
 109
109 -
 110
110 -
 111
111 -
 112
112 -
 113
113 -
 114
114 -
 115
115 -
 116
116 -
 117
117 -
 118
118 -
119
-
120
-
121
-
122
-
123
-
124
-
125
-
126
-
127
-
128
-
129
-
130
-
131
-
132
 |
 |

ECHOSTAR COMMUNICATIONS CORPORATION
NOTES TO CONSOLIDATED FINANCIAL STATEMENTS – Continued
F–23
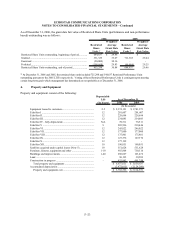
As of December 31, 2006, the grant date fair value of Restricted Share Units (performance and non-performance
based) outstanding was as follows:
Restricted
Share
Units *
Weighted-
Average
Grant Date
Fair Value
Restricted
Share
Units *
Weighted-
Average
Grant Date
Fair Value
Restricted Share Units outstanding, beginning of period............. 644,637 29.46$ - -$
Granted ....................................................................................... 331,329 33.27 711,303 29.44
Exercised .................................................................................... (20,000) 30.16 - -
Forfeited....................................................................................... (100,668) 29.83 (66,666) 29.25
Restricted Share Units outstanding, end of period....................... 855,298 30.88 644,637 29.46
2006 2005
* At December 31, 2006 and 2005, the restricted share units included 725,298 and 544,637 Restricted Performance Units
outstanding pursuant to the 2005 LTIP, respectively. Vesting of these Restricted Performance Units is contingent upon meeting
certain long-term goals which management has determined are not probable as of December 31, 2006.
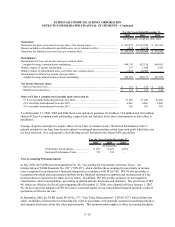
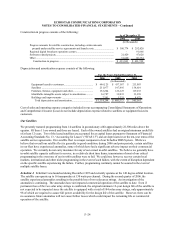
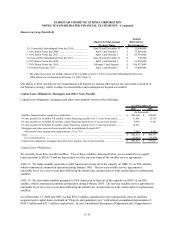
4. Property and Equipment
Property and equipment consist of the following:
Depreciable
Life As of December 31,
(In Years) 2006 2005
(In thousands)
Equipment leased to customers................................................. 2-5 2,374,121$ 1,781,373$
EchoStar I ................................................................................ 12 201,607 201,607
EchoStar II ............................................................................... 12 228,694 228,694
EchoStar III .............................................................................. 12 234,083 234,083
EchoStar IV - fully depreciated................................................. N/A 78,511 78,511
EchoStar V ............................................................................... 9 205,996 210,446
EchoStar VI .............................................................................. 12 245,022 246,022
EchoStar VII ............................................................................ 12 177,000 177,000
EchoStar VIII ........................................................................... 12 175,801 175,801
EchoStar IX .............................................................................. 12 127,376 127,376
EchoStar X................................................................................ 12 177,192 -
EchoStar XII............................................................................. 10 190,051 190,051
Satellites acquired under capital leases (Note 5)....................... 10 551,628 551,628
Furniture, fixtures, equipment and other .................................. 1-10 955,864 750,516
Buildings and improvements .................................................... 1-40 250,627 163,472
Land ......................................................................................... - 30,195 30,509
Construction in progress .......................................................... - 433,843 491,748
Total property and equipment ............................................. $ 6,637,611 $ 5,638,837
Accumulated depreciation ........................................................ (2,872,015) (2,124,298)
Property and equipment, net ............................................... 3,765,596$ 3,514,539$