Dish Network 2006 Annual Report Download - page 95
Download and view the complete annual report
Please find page 95 of the 2006 Dish Network annual report below. You can navigate through the pages in the report by either clicking on the pages listed below, or by using the keyword search tool below to find specific information within the annual report.-
 1
1 -
2
-
3
-
4
-
5
-
6
-
7
-
8
-
9
-
10
-
11
-
12
-
13
-
14
-
15
-
16
-
17
-
18
-
19
-
20
-
21
-
22
-
23
-
24
-
25
-
26
-
27
-
28
-
29
-
30
-
31
-
32
-
33
-
34
-
35
-
36
-
37
-
38
-
39
-
40
-
41
-
42
-
43
-
44
-
45
-
46
-
47
-
48
-
49
-
50
-
51
-
52
-
53
-
54
-
55
-
56
-
57
-
58
-
59
-
60
-
61
-
62
-
63
-
64
-
65
-
66
-
67
-
68
-
69
-
70
-
71
-
72
-
73
-
74
-
75
-
76
-
77
-
78
-
79
-
80
-
81
-
82
-
83
-
84
-
 85
85 -
 86
86 -
 87
87 -
 88
88 -
 89
89 -
 90
90 -
 91
91 -
 92
92 -
 93
93 -
 94
94 -
 95
95 -
 96
96 -
 97
97 -
 98
98 -
 99
99 -
 100
100 -
 101
101 -
 102
102 -
 103
103 -
 104
104 -
 105
105 -
106
-
107
-
108
-
109
-
110
-
111
-
112
-
113
-
114
-
115
-
116
-
117
-
118
-
119
-
120
-
121
-
122
-
123
-
124
-
125
-
126
-
127
-
128
-
129
-
130
-
131
-
132
 |
 |

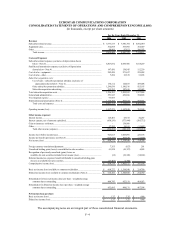
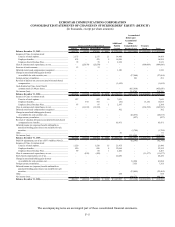
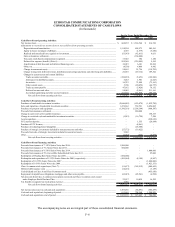
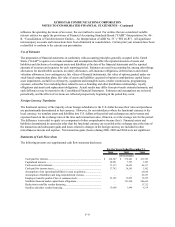
ECHOSTAR COMMUNICATIONS CORPORATION
NOTES TO CONSOLIDATED FINANCIAL STATEMENTS – Continued
F–10
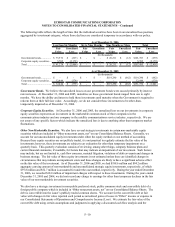
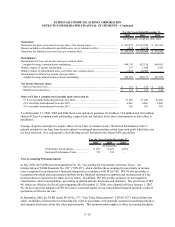
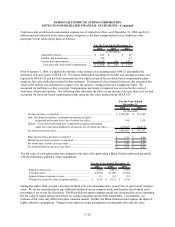
The following table reflects the length of time that the individual securities have been in an unrealized loss position,
aggregated by investment category, where those declines are considered temporary in accordance with our policy.
As of December 31, 2006
Less than Six Months Six to Nine Months Nine Months or More
Fair Unrealized Fair Unrealized Fair Unrealized Fair Unrealized
Value Loss Value Loss Value Loss Value Loss
(In thousands)
Government bonds................ 75,572$ (227)$ -$ -$ 26,211$ (12)$ 101,783$ (239)$
Corporate equity securities.... 5,702 (2,179) - - - - 5,702 (2,179)
Total ..................................... 81,274$ (2,406)$ -$ -$ 26,211$ (12)$ 107,485$ (2,418)$
As of December 31, 2005
(In thousands)
Government bonds................ -$ -$ -$ -$ 119,290$ (662)$ 119,290$ (662)$
Corporate equity securities.... 32,444 (379) - - - - 32,444 (379)
Total ..................................... 32,444$ (379)$ -$ -$ 119,290$ (662)$ 151,734$ (1,041)$
Total
Government Bonds. We believe the unrealized losses on our government bonds were caused primarily by interest
rate increases. At December 31, 2006 and 2005, maturities on these government bonds ranged from one to eight
months. We have the ability and intent to hold these investments until maturity when the Government is required to
redeem them at their full face value. Accordingly, we do not consider these investments to be other-than-
temporarily impaired as of December 31, 2006.
Corporate Equity Securities. At December 31, 2006 and 2005, the unrealized loss on our investments in corporate
equity securities represents an investment in the marketable common stock of three companies in the
communications industry and one company in the satellite communications service industry, respectively. We are
not aware of any specific factors which indicate the unrealized loss is due to anything other than temporary market
fluctuations.
Other Non-Marketable Securities. We also have several strategic investments in certain non-marketable equity
securities which are included in “Other noncurrent assets, net” on our Consolidated Balance Sheets. Generally, we
account for our unconsolidated equity investments under either the equity method or cost method of accounting.
Because these equity securities are not publicly traded, it is not practical to regularly estimate the fair value of the
investments; however, these investments are subject to an evaluation for other than temporary impairment on a
quarterly basis. This quarterly evaluation consists of reviewing, among other things, company business plans and
current financial statements, if available, for factors that may indicate an impairment of our investment. Such factors
may include, but are not limited to, cash flow concerns, material litigation, violations of debt covenants and changes in
business strategy. The fair value of these equity investments is not estimated unless there are identified changes in
circumstances that may indicate an impairment exists and these changes are likely to have a significant adverse effect
on the fair value of the investment. As of December 31, 2006 and 2005, we had $188.6 million and $94.2 million
aggregate carrying amount of non-marketable and unconsolidated strategic equity investments, respectively, of which
$97.8 million and $52.7 million is accounted for under the cost method, respectively. During the year ended December
31, 2006, we recorded $18.0 million of impairment charges with respect to these investments. During the years ended
December 31, 2005 and 2004, we did not record any charge to earnings for other than temporary declines in the fair
value of our non-marketable investment securities.
We also have a strategic investment in non-public preferred stock, public common stock and convertible debt of a
foreign public company which is included in “Other noncurrent assets, net” on our Consolidated Balance Sheets. The
debt is convertible into the issuer’s publicly traded common shares. We account for the convertible debt at fair
value with changes in fair value reported each period as unrealized gains or losses in “Other” income or expense in
our Consolidated Statements of Operations and Comprehensive Income (Loss). We estimate the fair value of the
convertible debt using certain assumptions and judgments in applying a discounted cash flow analysis and the