Dish Network 2006 Annual Report Download - page 59
Download and view the complete annual report
Please find page 59 of the 2006 Dish Network annual report below. You can navigate through the pages in the report by either clicking on the pages listed below, or by using the keyword search tool below to find specific information within the annual report.-
 1
1 -
2
-
3
-
4
-
5
-
6
-
7
-
8
-
9
-
10
-
11
-
12
-
13
-
14
-
15
-
16
-
17
-
18
-
19
-
20
-
21
-
22
-
23
-
24
-
25
-
26
-
27
-
28
-
29
-
30
-
31
-
32
-
33
-
34
-
35
-
36
-
37
-
38
-
39
-
40
-
41
-
42
-
43
-
44
-
45
-
46
-
47
-
48
-
 49
49 -
 50
50 -
 51
51 -
 52
52 -
 53
53 -
 54
54 -
 55
55 -
 56
56 -
 57
57 -
 58
58 -
 59
59 -
 60
60 -
 61
61 -
 62
62 -
 63
63 -
 64
64 -
 65
65 -
 66
66 -
 67
67 -
 68
68 -
 69
69 -
70
-
71
-
72
-
73
-
74
-
75
-
76
-
77
-
78
-
79
-
80
-
81
-
82
-
83
-
84
-
85
-
86
-
87
-
88
-
89
-
90
-
91
-
92
-
93
-
94
-
95
-
96
-
97
-
98
-
99
-
100
-
101
-
102
-
103
-
104
-
105
-
106
-
107
-
108
-
109
-
110
-
111
-
112
-
113
-
114
-
115
-
116
-
117
-
118
-
119
-
120
-
121
-
122
-
123
-
124
-
125
-
126
-
127
-
128
-
129
-
130
-
131
-
132
 |
 |

Item 7. MANAGEMENT’S DISCUSSION AND ANALYSIS OF FINANCIAL CONDITION AND
RESULTS OF OPERATIONS – Continued
49
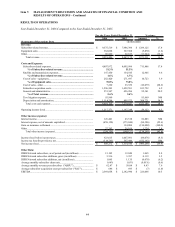
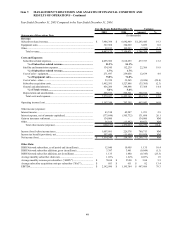
Year Ended December 31, 2005 Compared to the Year Ended December 31, 2004.
For the Years Ended December 31, Variance
2005 2004 Amount %
Statements of Operations Data (In thousands)
Revenue:
Subscriber-related revenue........................................................................ 7,986,394$ 6,692,949$ 1,293,445$ 19.3
Equipment sales......................................................................................... 367,968 364,929 3,039 0.8
Other.......................................................................................................... 92,813 100,593 (7,780) (7.7)
Total revenue...................................................................................... 8,447,175 7,158,471 1,288,704 18.0
Costs and Expenses:
Subscriber-related expenses................................................................... 4,095,986 3,618,259 477,727 13.2
% of Subscriber-related revenue................................................. 51.3% 54.1%
Satellite and transmission expenses........................................................ 134,545 112,239 22,306 19.9
% of Subscriber-related revenue................................................. 1.7% 1.7%
Cost of sales - equipment....................................................................... 271,697 259,058 12,639 4.9
% of Equipment sales.................................................................... 73.8% 71.0%
Cost of sales - other................................................................................ 23,339 33,265 (9,926) (29.8)
Subscriber acquisition costs................................................................... 1,492,581 1,527,886 (35,305) (2.3)
General and administrative..................................................................... 456,206 398,898 57,308 14.4
% of Total revenue........................................................................ 5.4% 5.6%
Depreciation and amortization............................................................... 805,573 505,561 300,012 59.3
Total costs and expenses.................................................................... 7,279,927 6,455,166 824,761 12.8
Operating income (loss)............................................................................ 1,167,248 703,305 463,943 66.0
Other income (expense):
Interest income.......................................................................................... 43,518 42,287 1,231 2.9
Interest expense, net of amounts capitalized............................................. (373,844) (505,732) 131,888 26.1
Gain on insurance settlement .................................................................... 134,000 - 134,000 NM
Other.......................................................................................................... 36,169 (13,482) 49,651 NM
Total other income (expense)............................................................. (160,157) (476,927) 316,770 66.4
Income (loss) before income taxes............................................................ 1,007,091 226,378 780,713 NM
Income tax benefit (provision), net............................................................ 507,449 (11,609) 519,058 NM
Net income (loss)...................................................................................... 1,514,540$ 214,769$ 1,299,771$ NM
Other Data:
DISH Network subscribers, as of period end (in millions)........................ 12.040 10.905 1.135 10.4
DISH Network subscriber additions, gross (in millions)........................... 3.397 3.441 (0.044) (1.3)
DISH Network subscriber additions, net (in millions).............................. 1.135 1.480 (0.345) (23.3)
Average monthly subscriber churn rate .................................................... 1.65% 1.62% 0.03% 1.9
Average monthly revenue per subscriber ("ARPU")................................ 58.04$ 55.00$ 3.04$ 5.5
Average subscriber acquisition costs per subscriber ("SAC")................... 693$ 611$ 82$ 13.4
EBITDA.................................................................................................... 2,142,990$ 1,195,384$ 947,606$ 79.3