Dish Network 2006 Annual Report Download - page 128
Download and view the complete annual report
Please find page 128 of the 2006 Dish Network annual report below. You can navigate through the pages in the report by either clicking on the pages listed below, or by using the keyword search tool below to find specific information within the annual report.-
 1
1 -
2
-
3
-
4
-
5
-
6
-
7
-
8
-
9
-
10
-
11
-
12
-
13
-
14
-
15
-
16
-
17
-
18
-
19
-
20
-
21
-
22
-
23
-
24
-
25
-
26
-
27
-
28
-
29
-
30
-
31
-
32
-
33
-
34
-
35
-
36
-
37
-
38
-
39
-
40
-
41
-
42
-
43
-
44
-
45
-
46
-
47
-
48
-
49
-
50
-
51
-
52
-
53
-
54
-
55
-
56
-
57
-
58
-
59
-
60
-
61
-
62
-
63
-
64
-
65
-
66
-
67
-
68
-
69
-
70
-
71
-
72
-
73
-
74
-
75
-
76
-
77
-
78
-
79
-
80
-
81
-
82
-
83
-
84
-
85
-
86
-
87
-
88
-
89
-
90
-
91
-
92
-
93
-
94
-
95
-
96
-
97
-
98
-
99
-
100
-
101
-
102
-
103
-
104
-
105
-
106
-
107
-
108
-
109
-
110
-
111
-
112
-
113
-
114
-
115
-
116
-
117
-
 118
118 -
 119
119 -
 120
120 -
 121
121 -
 122
122 -
 123
123 -
 124
124 -
 125
125 -
 126
126 -
 127
127 -
 128
128 -
 129
129 -
 130
130 -
 131
131 -
 132
132
 |
 |

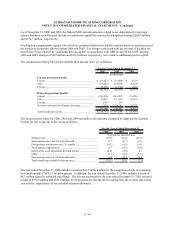
ECHOSTAR COMMUNICATIONS CORPORATION
NOTES TO CONSOLIDATED FINANCIAL STATEMENTS – Continued
F–43
EchoStar
DISH Technologies All Consolidated
Network Corporation Other Eliminations Total
Year Ended December 31, 2006 (In thousands)
Total revenue .................................................................... 9,514,347$ 186,984$ 146,190$ (29,035)$ 9,818,486$
Depreciation and amortization .......................................... 1,038,744 4,546 71,004 - 1,114,294
Total costs and expenses ................................................... 8,326,513 219,299 84,338 (29,035) 8,601,115
Interest income .................................................................. 123,995 4 2,402 - 126,401
Interest expense, net of amounts capitalized ..................... (457,149) (74) (927) - (458,150)
Income tax benefit (provision), net ................................... (310,408) 22,887 (27,222) - (314,743)
Net income (loss) .............................................................. 581,342 (9,498) 36,428 - 608,272
Year Ended December 31, 2005
Total revenue .................................................................... 8,172,592$ 174,195$ 113,899$ (13,511)$ 8,447,175$
Depreciation and amortization .......................................... 744,624 4,597 56,352 - 805,573
Total costs and expenses ................................................... 7,039,054 190,479 63,905 (13,511) 7,279,927
Interest income .................................................................. 42,316 - 1,202 - 43,518
Interest expense, net of amounts capitalized ..................... (372,752) (105) (987) - (373,844)
Income tax benefit (provision), net ................................... 514,048 (2,712) (3,887) - 507,449
Net income (loss) .............................................................. 1,487,467 (19,097) 46,170 - 1,514,540
Year Ended December 31, 2004
Total revenue .................................................................... 6,937,118$ 125,881$ 104,340$ (8,868)$ 7,158,471$
Depreciation and amortization .......................................... 449,482 6,718 49,361 -
505,561
Total costs and expenses ................................................... 6,232,536 154,147 77,351 (8,868) 6,455,166
Interest income .................................................................. 41,717 - 570 - 42,287
Interest expense, net of amounts capitalized ..................... (504,612) (133) (987) - (505,732)
Income tax benefit (provision), net ................................... (11,464) (385) 240 - (11,609)
Net income (loss) .............................................................. 215,812 (28,767) 27,724 - 214,769
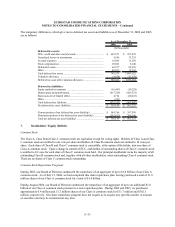
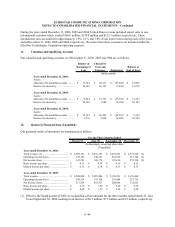
Geographic Information and Transactions with Major Customers
United
States International Total
(In thousands)
Long-lived assets, including FCC authorizations
2006............................................................................. 4,651,079$ 60,481$ 4,711,560$
2005............................................................................. 4,475,177$ 14,299$ 4,489,476$
Revenue
2006............................................................................. 9,739,699$ 78,787$ 9,818,486$
2005............................................................................. 8,389,760$ 57,415$ 8,447,175$
2004............................................................................. 7,098,978$ 59,493$ 7,158,471$
Revenues are attributed to geographic regions based upon the location from where the sale originated. United States
revenue includes transactions with both United States and customers abroad. International revenue includes
transactions with customers in Europe, Africa and the Middle East. Revenues from these customers are included
within the All Other operating segment.