Costco 2003 Annual Report Download - page 46
Download and view the complete annual report
Please find page 46 of the 2003 Costco annual report below. You can navigate through the pages in the report by either clicking on the pages listed below, or by using the keyword search tool below to find specific information within the annual report.-
 1
1 -
2
-
3
-
4
-
5
-
6
-
7
-
8
-
9
-
10
-
11
-
12
-
13
-
14
-
15
-
16
-
17
-
18
-
19
-
20
-
21
-
22
-
23
-
24
-
25
-
26
-
27
-
28
-
29
-
30
-
31
-
32
-
33
-
34
-
35
-
 36
36 -
 37
37 -
 38
38 -
 39
39 -
 40
40 -
 41
41 -
 42
42 -
 43
43 -
 44
44 -
 45
45 -
 46
46 -
 47
47 -
 48
48 -
 49
49 -
 50
50 -
 51
51 -
 52
52
 |
 |

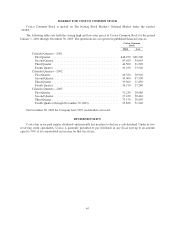
NOTES TO CONSOLIDATED FINANCIAL STATEMENTS
(dollars in thousands, except per share data) (Continued)
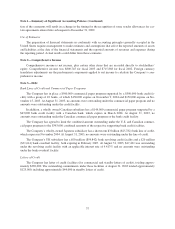
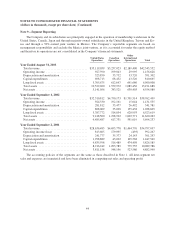
Note 9—Segment Reporting
The Company and its subsidiaries are principally engaged in the operation of membership warehouses in the
United States, Canada, Japan and through majority-owned subsidiaries in the United Kingdom, Taiwan and Ko-
rea and through a 50%-owned joint venture in Mexico. The Company’s reportable segments are based on
management responsibility and exclude the Mexico joint-venture, as it is accounted for under the equity method
and therefore its operations are not consolidated in the Company’s financial statements.
United States
Operations
Canadian
Operations
Other
International
Operations Total
Year Ended August 31, 2003
Total revenue ................................ $35,119,039 $5,237,023 $2,189,490 $42,545,552
Operating income ............................ 927,590 199,043 29,995 1,156,628
Depreciation and amortization .................. 323,850 33,732 33,720 391,302
Capital expenditures .......................... 698,713 68,432 43,520 810,665
Long lived assets ............................. 5,705,675 612,647 641,686 6,960,008
Total assets ................................. 10,522,260 1,579,972 1,089,456 13,191,688
Net assets ................................... 5,141,056 783,521 630,403 6,554,980
Year Ended September 1, 2002
Total revenue ................................ $32,310,812 $4,750,173 $1,701,514 $38,762,499
Operating income ............................ 924,330 192,161 15,044 1,131,535
Depreciation and amortization .................. 281,812 33,477 26,492 341,781
Capital expenditures .......................... 868,069 35,098 135,438 1,038,605
Long lived assets ............................. 5,387,772 514,854 620,993 6,523,619
Total assets ................................. 9,418,500 1,198,992 1,002,771 11,620,263
Net assets ................................... 4,485,487 617,731 591,019 5,694,237
Year Ended September 2, 2001
Total revenue ................................ $28,636,483 $4,695,778 $1,464,776 $34,797,037
Operating income (loss) ....................... 813,665 179,095 (493) 992,267
Depreciation and amortization .................. 241,777 35,377 24,143 301,297
Capital expenditures .......................... 1,298,889 43,092 105,568 1,447,549
Long lived assets ............................. 4,835,598 516,489 474,498 5,826,585
Total assets ................................. 8,216,242 1,093,789 779,755 10,089,786
Net assets ................................... 3,811,158 548,196 523,586 4,882,940
The accounting policies of the segments are the same as those described in Note 1. All inter-segment net
sales and expenses are immaterial and have been eliminated in computing net sales and operating profit.
44