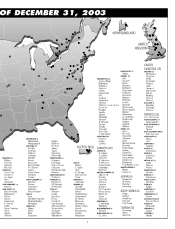
Costco 2003 Annual Report Download - page 3
Download and view the complete annual report
Please find page 3 of the 2003 Costco annual report below. You can navigate through the pages in the report by either clicking on the pages listed below, or by using the keyword search tool below to find specific information within the annual report.-
 1
1 -
 2
2 -
 3
3 -
 4
4 -
 5
5 -
 6
6 -
 7
7 -
 8
8 -
 9
9 -
 10
10 -
 11
11 -
 12
12 -
 13
13 -
 14
14 -
15
-
16
-
17
-
18
-
19
-
20
-
21
-
22
-
23
-
24
-
25
-
26
-
27
-
28
-
29
-
30
-
31
-
32
-
33
-
34
-
35
-
36
-
37
-
38
-
39
-
40
-
41
-
42
-
43
-
44
-
45
-
46
-
47
-
48
-
49
-
50
-
51
-
52
 |
 |

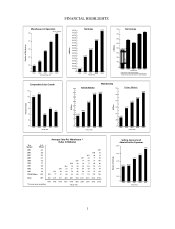
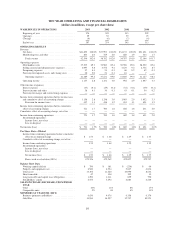
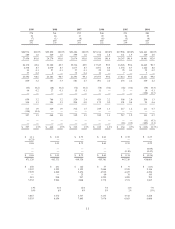
FINANCIAL HIGHLIGHTS
1
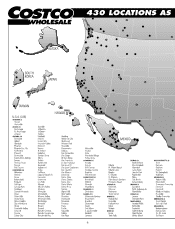
Warehouses in Operation
At Fiscal Year End
Number of Warehouses
400
375
1999 2000 2001 2003
350
325
313
345
397
(407 at 12/31/03)
292
300
0
2002
374
Net Sales
Fiscal Year
$ Millions
38,000
39,000
40,000
41,000
42,000
37,000
36,000
35,000
34,000
33,000
32,000
31,000
30,000
29,000
28,000
27,000
0
1999 2000 2001 2002
26,976
34,137
37,993
31,621
2002 2003
41,693 Net Income
Fiscal Year
$ Millions
1999 2000 2001 2003
650
700
750
0
500
550
600
400
450
*
**
Income from continuing operations
Income from continuing operations excluding asset
impairment/closing costs and/or accounting change
602*
631*
721*
2002
700*
545**
Closing/
Impairment
Accounting
Change
515**
397*
Comparable Sales Growth
Fiscal Year
Percent Increase
1999 2000 2001 2003
10%
4%
5%
11%
0%
2%
4%
6%
8%
10%
12%
2002
6%
Average Sales Per Warehouse *
(Sales In Millions)
Fiscal Year
*First year sales annualized.
2000
111
92
80
72
99
77
$57
$101
1999
102
82
68
58
85
$65
$94
1998
94
76
61
$50
70
$87
1997
88
69
53
$56
$83
1996
81
58
$46
$77
1995
77
$51
$75
1994
$76
$76
397Totals
2121994 & Before
191995
181996
101997
171998
151999
212000
322001
292002
242003
Whses*Opened # ofYear
2001
115
93
83
77
106
86
65
$57
$101
2002
120
97
87
82
113
97
77
63
$103
$58
2003
124
103
94
86
115
105
85
72
$105
62
$67
Selling, General and
Administrative Expenses
Fiscal Year
Percent of Net Sales
1999 2000 2001 2002
0
8.5%
10.0%
9.5%
9.0%
9.41%
8.71%
9.17%
8.67%
2003
9.83%
8.0%
Fiscal Year
1999 2000 2001 2003
4.170
4.636
4.358
3.887
3.8
4.0
4.2
4.4
4.6
4.8
0
2002
4.476
Business Members
Fiscal Year
Millions
Millions
1999 2000 2001 2003
10.521
12.737
14.984
9.555
0
10
12
16
15
9
11
14
13
2002
14.597
Gold Star Members
Membership