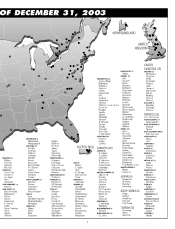
Costco 2003 Annual Report Download - page 11
Download and view the complete annual report
Please find page 11 of the 2003 Costco annual report below. You can navigate through the pages in the report by either clicking on the pages listed below, or by using the keyword search tool below to find specific information within the annual report.-
 1
1 -
 2
2 -
 3
3 -
 4
4 -
 5
5 -
 6
6 -
 7
7 -
 8
8 -
 9
9 -
 10
10 -
 11
11 -
 12
12 -
 13
13 -
 14
14 -
 15
15 -
 16
16 -
 17
17 -
 18
18 -
 19
19 -
 20
20 -
 21
21 -
 22
22 -
23
-
24
-
25
-
26
-
27
-
28
-
29
-
30
-
31
-
32
-
33
-
34
-
35
-
36
-
37
-
38
-
39
-
40
-
41
-
42
-
43
-
44
-
45
-
46
-
47
-
48
-
49
-
50
-
51
-
52
 |
 |

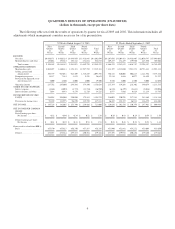
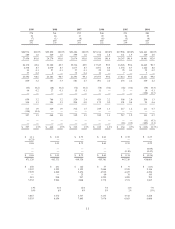
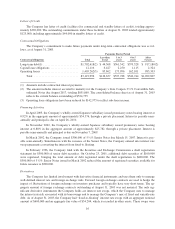
QUARTERLY RESULTS OF OPERATIONS (UNAUDITED)
(dollars in thousands, except per share data)
The following table sets forth the results of operations by quarter for fiscal 2003 and 2002. This information includes all
adjustments which management considers necessary for a fair presentation.
52 Weeks Ended August 31, 2003 52 Weeks Ended September 1, 2002
First
Quarter
12
Weeks
Second
Quarter
12
Weeks
Third
Quarter
12
Weeks
Fourth
Quarter
16
Weeks
Total
52
Weeks
First
Quarter
12
Weeks
Second
Quarter
12
Weeks
Third
Quarter
12
Weeks
Fourth
Quarter
16
Weeks
Total
52
Weeks
REVENUE
Net sales .................... $9,010,571 $ 9,920,324 $9,344,959 $13,416,845 $41,692,699 $8,297,076 $9,208,413 $8,436,807 $12,050,797 $37,993,093
Membership fees and other ..... 188,014 193,843 198,112 272,884 852,853 169,477 174,439 179,940 245,550 769,406
Total revenue .............. 9,198,585 10,114,167 9,543,071 13,689,729 42,545,552 8,466,553 9,382,852 8,616,747 12,296,347 38,762,499
OPERATING EXPENSES
Merchandise costs ............ 8,048,897 8,840,411 8,358,323 11,987,752 37,235,383 7,434,397 8,212,030 7,583,251 10,753,443 33,983,121
Selling, general and
administrative ............. 888,779 967,051 923,309 1,318,259 4,097,398 786,118 840,005 806,617 1,142,796 3,575,536
Preopening expenses .......... 18,117 7,145 5,853 5,528 36,643 22,134 8,616 6,077 14,430 51,257
Provision for impaired assets
and closing costs ........... 5,000 4,500 6,000 4,000 19,500 8,550 3,000 4,500 5,000 21,050
Operating income ............ 237,792 295,060 249,586 374,190 1,156,628 215,354 319,201 216,302 380,678 1,131,535
OTHER INCOME (EXPENSE)
Interest expense .............. (8,468) (8,003) (8,715) (11,734) (36,920) (6,238) (6,199) (8,643) (8,016) (29,096)
Interest income and other ...... 7,634 8,983 9,179 12,729 38,525 6,977 7,926 9,624 11,218 35,745
INCOME BEFORE INCOME
TAXES .................... 236,958 296,040 250,050 375,185 1,158,233 216,093 320,928 217,283 383,880 1,138,184
Provision for income taxes ..... 91,229 113,975 96,270 135,759 437,233 86,437 128,372 86,913 136,479 438,201
NET INCOME ................. $ 145,729 $ 182,065 $ 153,780 $ 239,426 $ 721,000 $ 129,656 $ 192,556 $ 130,370 $ 247,401 $ 699,983
NET INCOME PER COMMON
SHARE:
Basic Earnings per share:
Net Income ............... $ 0.32 $ 0.40 $ 0.34 $ 0.52 $ 1.58 $ 0.29 $ 0.43 $ 0.29 $ 0.54 $ 1.54
Diluted earnings per share:
Net Income ............... $ 0.31 $ 0.39 $ 0.33 $ 0.51 $ 1.53 $ 0.28 $ 0.41 $ 0.28 $ 0.52 $ 1.48
Shares used in calculation (000’s):
Basic ...................... 455,570 455,927 456,370 457,187 456,335 451,990 452,882 454,272 455,008 453,650
Diluted ..................... 478,857 478,564 479,183 480,384 479,326 477,395 479,931 480,256 479,240 479,262
9