Costco 2003 Annual Report Download - page 14
Download and view the complete annual report
Please find page 14 of the 2003 Costco annual report below. You can navigate through the pages in the report by either clicking on the pages listed below, or by using the keyword search tool below to find specific information within the annual report.-
 1
1 -
2
-
3
-
 4
4 -
 5
5 -
 6
6 -
 7
7 -
 8
8 -
 9
9 -
 10
10 -
 11
11 -
 12
12 -
 13
13 -
 14
14 -
 15
15 -
 16
16 -
 17
17 -
 18
18 -
 19
19 -
 20
20 -
 21
21 -
 22
22 -
 23
23 -
 24
24 -
25
-
26
-
27
-
28
-
29
-
30
-
31
-
32
-
33
-
34
-
35
-
36
-
37
-
38
-
39
-
40
-
41
-
42
-
43
-
44
-
45
-
46
-
47
-
48
-
49
-
50
-
51
-
52
 |
 |
MANAGEMENT’S DISCUSSION AND ANALYSIS OF FINANCIAL CONDITION
AND RESULTS OF OPERATIONS
Certain statements contained in this document constitute forward-looking statements within the meaning of
the Private Securities Litigation Reform Act of 1995. For these purposes, forward-looking statements are state-
ments that address activities, events, conditions or developments that the Company expects or anticipates may
occur in the future. Such forward-looking statements involve risks and uncertainties that may cause actual events,
results or performance to differ materially from those indicated by such statements. These risks and uncertainties
include, but are not limited to, domestic and international economic conditions including exchange rates, the ef-
fects of competition and regulation, conditions affecting the acquisition, development, ownership or use of real
estate, actions of vendors, rising costs associated with employees (including health care and workers’ compensa-
tion costs), consumer and small business debt levels and spending patterns, and other risks identified from time
to time in the Company’s public statements and reports filed with the Securities and Exchange Commission.
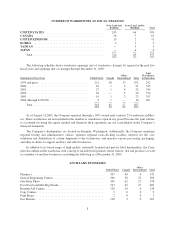
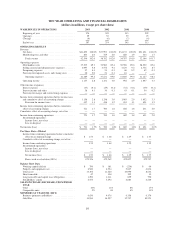
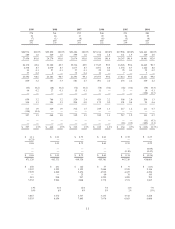
Comparison of Fiscal 2003 (52 weeks) and Fiscal 2002 (52 weeks):
(dollars in thousands, except earnings per share)
Net income for fiscal 2003 increased 3% to $721,000, or $1.53 per diluted share, from $699,983, or $1.48
per diluted share during fiscal year 2002.
Net sales increased 10% to $41,692,699 in fiscal 2003 from $37,993,093 in fiscal 2002. Approximately 55%
of the increase was due to an increase in comparable warehouse sales, that is sales in warehouses open for at least
a year, and approximately 45% of the increase was due to opening a net of 23 new warehouses (29 opened, 6
closed) during fiscal 2003 and a net of 29 new warehouses (35 opened, 6 closed) during fiscal 2002, a portion of
which is not included in comparable warehouse sales. With the exception of gasoline, which accounted for a
comparable sales increase of approximately 70 basis points, changes in prices of merchandise did not materially
contribute to sales increases. In addition, due to the weaker US dollar, translation of foreign sales into US dollars
contributed to the increase in sales, accounting for a comparable sales increase of approximately one percent
year-over-year. Comparable sales increased at a 5% annual rate in fiscal 2003 compared to a 6% annual rate dur-
ing fiscal 2002.
Membership fees and other revenue increased 11% to $852,853, or 2.05% of net sales, in fiscal 2003 from
$769,406, or 2.03% of net sales, in fiscal 2002. This increase was primarily due to additional membership sign-
ups at the 23 new warehouses opened in fiscal 2003, and increased penetration of the Company’s Executive
Membership. Overall, member renewal rates remained consistent with the prior year, currently at 86%.
Gross margin (defined as net sales minus merchandise costs) increased 11% to $4,457,316, or 10.69% of net
sales, in fiscal 2003 from $4,009,972, or 10.55% of net sales, in fiscal 2002. The increase in gross margin as a
percentage of net sales reflects merchandise gross margin improvement within the Company’s ancillary ware-
house businesses and international operations accounting for increases of 15 and 8 basis points, respectively.
Additionally, increased rewards related to the Executive Membership Two-Percent Reward Program reduced
gross margin by 7 basis points. The gross margin figures reflect accounting for most U.S. merchandise in-
ventories on the last-in, first-out (LIFO) method. The effect of the LIFO adjustment for fiscal 2003 was to in-
crease gross margin by $19,650, compared to a gross margin increase of $13,500 in fiscal 2002. If all inventories
had been valued using the first-in, first-out (FIFO) method, inventories would have been lower by $19,500 at
August 31, 2003 and higher by $150 at September 1, 2002.
Selling, general and administrative expenses as a percent of net sales increased to 9.83% during fiscal 2003
from 9.41% during fiscal 2002. The increase in selling, general and administrative expenses as a percent of net
sales was primarily due to increases in healthcare, workers’ compensation (primarily in the state of California)
and salary costs within the Company’s domestic operations. International expenses also increased, accounting for
approximately 7 basis points of the 42 basis points year-over-year increase.
Preopening expenses totaled $36,643, or 0.09% of net sales, during fiscal 2003 and $51,257, or 0.13% of net
sales, during fiscal 2002. During fiscal 2003, the Company opened 29 new warehouses (including 5 relocations)
12