Costco 2003 Annual Report Download - page 43
Download and view the complete annual report
Please find page 43 of the 2003 Costco annual report below. You can navigate through the pages in the report by either clicking on the pages listed below, or by using the keyword search tool below to find specific information within the annual report.-
 1
1 -
2
-
3
-
4
-
5
-
6
-
7
-
8
-
9
-
10
-
11
-
12
-
13
-
14
-
15
-
16
-
17
-
18
-
19
-
20
-
21
-
22
-
23
-
24
-
25
-
26
-
27
-
28
-
29
-
30
-
31
-
32
-
 33
33 -
 34
34 -
 35
35 -
 36
36 -
 37
37 -
 38
38 -
 39
39 -
 40
40 -
 41
41 -
 42
42 -
 43
43 -
 44
44 -
 45
45 -
 46
46 -
 47
47 -
 48
48 -
 49
49 -
 50
50 -
 51
51 -
 52
52
 |
 |

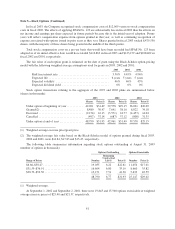
Note 5—Stock Options (Continued)
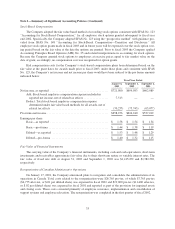
In fiscal 2003, the Company recognized stock compensation costs of $12,069 versus no stock compensation
costs in fiscal 2002. The effects of applying SFAS No. 123 are substantially less in fiscal 2003 than the effects on
net income and earnings per share expected in future periods because this is the initial year of adoption. Future
years will reflect compensation expense from options granted in that year, as well as continuing recognition of
expense associated with options issued in prior years as they vest. Shares granted in fiscal 2003 totaled 8,479,550
shares, with the majority of these shares being granted in the middle of the third quarter.
Total stock compensation costs on a pre-tax basis that would have been recorded had SFAS No. 123 been
adopted as of its initial effective date would have totaled $112,863 in fiscal 2003 and $123,159 and $108,462 in
fiscal 2002 and 2001, respectively.
The fair value of each option grant is estimated on the date of grant using the Black-Scholes option-pricing
model with the following weighted average assumptions used for grants in 2003, 2002 and 2001:
2003 2002 2001
Risk free interest rate .................................. 3.30% 4.45% 4.96%
Expected life ......................................... 6years 5 years 5 years
Expected volatility .................................... 46% 46% 43%
Expected dividend yield ................................ 0% 0% 0%
Stock option transactions relating to the aggregate of the 1993 and 2002 plans are summarized below
(shares in thousands):
2003 2002 2001
Shares Price(1) Shares Price(1) Shares Price(1)
Under option at beginning of year ........... 42,961 $31.49 39,578 $29.15 36,021 $26.09
Granted(2) ............................. 8,480 30.47 7,641 38.10 8,822 34.18
Exercised .............................. (2,154) 16.13 (3,571) 18.77 (4,457) 14.04
Cancelled .............................. (497) 37.14 (687) 37.12 (808) 31.35
Under option at end of year ................ 48,790 $31.93 42,961 $31.49 39,578 $29.15
(1) Weighted-average exercise price/grant price.
(2) The weighted-average fair value based on the Black-Scholes model of options granted during fiscal 2003,
2002 and 2001, were $14.84, $17.83 and $15.47, respectively.
The following table summarizes information regarding stock options outstanding at August 31, 2003
(number of options in thousands):
Options Outstanding Options Exercisable
Range of Prices Number
Remaining
Contractual
Life(1) Price(1) Number Price(1)
$6.66–$30.47 ............................... 19,035 6.22 $22.61 11,054 $17.01
$31.55–$36.91 .............................. 16,604 6.80 35.19 8,660 35.82
$38.79–$52.50 .............................. 13,151 7.51 41.30 5,433 42.59
48,790 6.77 $31.93 25,147 $29.02
(1) Weighted-average.
At September 1, 2002 and September 2, 2001, there were 19,843 and 15,500 options exercisable at weighted
average exercise prices of $25.40 and $21.57, respectively.
41