Costco 2003 Annual Report Download - page 12
Download and view the complete annual report
Please find page 12 of the 2003 Costco annual report below. You can navigate through the pages in the report by either clicking on the pages listed below, or by using the keyword search tool below to find specific information within the annual report.-
 1
1 -
 2
2 -
 3
3 -
 4
4 -
 5
5 -
 6
6 -
 7
7 -
 8
8 -
 9
9 -
 10
10 -
 11
11 -
 12
12 -
 13
13 -
 14
14 -
 15
15 -
 16
16 -
 17
17 -
 18
18 -
 19
19 -
 20
20 -
 21
21 -
 22
22 -
23
-
24
-
25
-
26
-
27
-
28
-
29
-
30
-
31
-
32
-
33
-
34
-
35
-
36
-
37
-
38
-
39
-
40
-
41
-
42
-
43
-
44
-
45
-
46
-
47
-
48
-
49
-
50
-
51
-
52
 |
 |

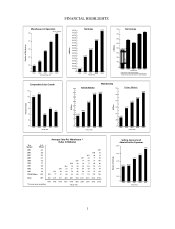
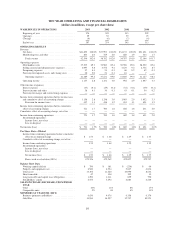
TEN YEAR OPERATING AND FINANCIAL HIGHLIGHTS
(dollars in millions, except per share data)
WAREHOUSES IN OPERATIONS 2003 2002 2001 2000
Beginning of year ............................. 374 345 313 292
Openings .................................... 29 35 39 25
Closings .................................... (6) (6) (7) (4)
End of year .................................. 397 374 345 313
OPERATING RESULTS
Revenue
Net Sales .................................... $41,693 100.0% $37,993 100.0% $34,137 100.0% $31,621 100.0%
Membership fees and other ..................... 853 2.0 769 2.0 660 1.9 543 1.7
Total revenue .............................. 42,546 102.0 38,762 102.0 34,797 101.9 32,164 101.7
Operating expenses
Merchandise costs ............................ 37,235 89.3 33,983 89.4 30,598 89.6 28,322 89.6
Selling, general and administrative expenses ........ 4,097 9.8 3,576 9.4 3,129 9.2 2,756 8.7
Preopening expenses .......................... 37 0.1 51 0.1 60 0.2 42 0.1
Provision for impaired assets and closing costs ...... 20 0.0 21 0.1 18 — 7 —
Operating expenses .......................... 41,389 99.2 37,631 99.0 33,805 99.0 31,127 98.4
Operating income ............................. 1,157 2.8 1,131 3.0 992 2.9 1,037 3.3
Other income (expenses)
Interest expense .............................. (37) (0.1) (29) (0.1) (32) (0.1) (39) (0.1)
Interest income and other ....................... 38 0.1 36 0.1 43 0.1 54 0.2
Provision for merger and restructuring expenses ..... — — — — — — — —
Income from continuing operations before income taxes
and cumulative effect of accounting change ........ 1,158 2.8 1,138 3.0 1,003 2.9 1,052 3.3
Provision for income taxes .................... 437 1.1 438 1.2 401 1.1 421 1.3
Income from continuing operations before cumulative
effect of accounting change ..................... 721 1.7 700 1.8 602 1.8 631 2.0
Cumulative effect of accounting change, net of tax ..... — — — — — — — —
Income from continuing operations ................. 721 1.7 700 1.8 602 1.8 631 2.0
Discontinued operations:
Income (loss), net of tax ...................... — — — — — — — —
Loss on disposal ............................ — — — — — — — —
Net income (loss) ............................... $ 721 1.7% $ 700 1.8% $ 602 1.8% $ 631 2.0%
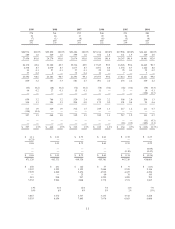
Per Share Data—Diluted
Income from continuing operations before cumulative
effect of accounting change ................... $ 1.53 $ 1.48 $ 1.29 $ 1.35
Cumulative effect of accounting change, net of tax . . . — — — —
Income from continuing operations ............... 1.53 1.48 1.29 1.35
Discontinued operations:
Income (loss), net of tax ...................... — — — —
Loss on disposal ............................ — — — —
Net income (loss) ........................... $ 1.53 $ 1.48 $ 1.29 $ 1.35
Shares used in calculation (000’s) .............. 479,326 479,262 475,827 475,737
Balance Sheet Data
Working capital (deficit) ....................... $ 700 $ 181 $ (230) $ 66
Property and equipment, net ..................... 6,960 6,524 5,827 4,834
Total assets .................................. 13,192 11,620 10,090 8,634
Short-term debt ............................... 47 104 195 10
Long-term debt and capital lease obligations ........ 1,290 1,211 859 790
Stockholders’ equity ........................... 6,555 5,694 4,883 4,240
SALES INCREASE (DECREASE) FROM PRIOR
YEAR
Total ....................................... 10% 11% 8% 17%
Comparable units ............................. 5% 6% 4% 11%
MEMBERS AT YEAR END (000’S)
Business (primary cardholders) .................. 4,636 4,476 4,358 4,170
Gold Star .................................... 14,984 14,597 12,737 10,521
10