Costco 2000 Annual Report Download - page 9
Download and view the complete annual report
Please find page 9 of the 2000 Costco annual report below. You can navigate through the pages in the report by either clicking on the pages listed below, or by using the keyword search tool below to find specific information within the annual report.-
 1
1 -
 2
2 -
 3
3 -
 4
4 -
 5
5 -
 6
6 -
 7
7 -
 8
8 -
 9
9 -
 10
10 -
 11
11 -
 12
12 -
 13
13 -
 14
14 -
 15
15 -
 16
16 -
 17
17 -
 18
18 -
 19
19 -
 20
20 -
21
-
22
-
23
-
24
-
25
-
26
-
27
-
28
-
29
-
30
-
31
-
32
-
33
-
34
-
35
-
36
-
37
-
38
-
39
 |
 |

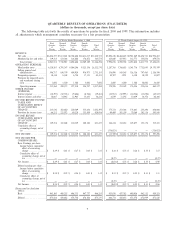
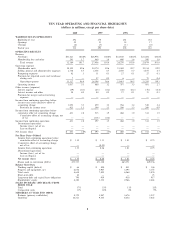
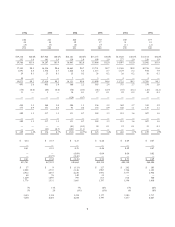
TEN YEAR OPERATING AND FINANCIAL HIGHLIGHTS
(dollars in millions, except per share data)
2000 1999 1998 1997
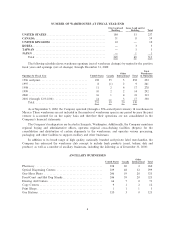
WAREHOUSES IN OPERATIONS
Beginning of year 292 278 261 252
Openings 25 21 18 17
Closings (4) (7) (1) (8)
End of year 313 292 278 261
OPERATING RESULTS
Revenue
Net Sales $31,621 100.0% $26,976 100.0% $23,830 100.0% $21,484 100.0%
Membership fees and other 543 1.7 480 1.8 440 1.8 390 1.8
Total revenue 32,164 101.7 27,456 101.8 24,270 101.8 21,874 101.8
Operating expenses
Merchandise costs 28,322 89.6 24,170 89.6 21,380 89.7 19,314 89.9
Selling, general and administrative expenses 2,756 8.7 2,338 8.7 2,070 8.7 1,877 8.7
Preopening expenses 42 .1 31 0.1 27 0.1 27 0.1
Provision for impaired assets and warehouse
closing costs 7 Ì 57 0.2 6 Ì 75 0.4
Operating expenses 31,127 98.4 26,596 98.6 23,483 98.5 21,293 99.1
Operating income 1,037 3.3 860 3.2 787 3.3 581 2.7
Other income (expenses)
Interest expense (39) (0.1) (45) (0.2) (48) (0.2) (76) (0.4)
Interest income and other 54 0.2 44 0.2 27 0.1 15 0.1
Provision for merger and restructuring
expenses Ì Ì Ì Ì Ì Ì Ì Ì
Income from continuing operations before
income taxes and cumulative eÅect of
accounting change 1,052 3.3 859 3.2 766 3.2 520 2.4
Provision for income taxes 421 1.3 344 1.3 306 1.3 208 0.9
Income from continuing operations before
cumulative eÅect of accounting change 631 2.0 515 1.9 460 1.9 312 1.5
Cumulative eÅect of accounting change, net
of tax Ì Ì (118) (0.4) Ì Ì Ì Ì
Income from continuing operations 631 2.0 397 1.5 460 1.9 312 1.5
Discontinued operations:
Income (loss), net of tax Ì Ì Ì Ì Ì Ì Ì Ì
Loss on disposal Ì Ì Ì Ì Ì Ì Ì Ì
Net income (loss) $ 631 2.0% $ 397 1.5% $ 460 1.9% $ 312 1.5%
Per Share DataÌDiluted
Income from continuing operations before
cumulative eÅect of accounting change $ 1.35 $ 1.11 $ 1.01 $ 0.73
Cumulative eÅect of accounting change,
net of tax Ì (0.25) Ì Ì
Income from continuing operations 1.35 0.86 1.01 0.73
Discontinued operations:
Income (loss), net of tax ÌÌÌÌ
Loss on disposal ÌÌÌÌ
Net income (loss) $ 1.35 $ 0.86 $ 1.01 $ 0.73
Shares used in calculation (000's) 475,737 471,120 463,371 449,336
Balance Sheet Data
Working capital (deÑcit) $ 66 $ 450 $ 431 $ 146
Property and equipment, net 4,834 3,907 3,395 3,155
Total assets 8,634 7,505 6,260 5,476
Short-term debt 10ÌÌ25
Long-term debt and capital lease obligations 790 919 930 917
Stockholders' equity 4,240 3,532 2,966 2,468
SALES INCREASE (DECREASE) FROM
PRIOR YEAR
Total 17% 13% 11% 12%
Comparable units 11% 10% 8% 9%
MEMBERS AT YEAR END (000'S)
Business (primary cardholders) 4,170 3,887 3,676 3,537
Gold Star 10,521 9,555 8,654 7,845
8