Costco 2000 Annual Report Download - page 11
Download and view the complete annual report
Please find page 11 of the 2000 Costco annual report below. You can navigate through the pages in the report by either clicking on the pages listed below, or by using the keyword search tool below to find specific information within the annual report.-
 1
1 -
 2
2 -
 3
3 -
 4
4 -
 5
5 -
 6
6 -
 7
7 -
 8
8 -
 9
9 -
 10
10 -
 11
11 -
 12
12 -
 13
13 -
 14
14 -
 15
15 -
 16
16 -
 17
17 -
 18
18 -
 19
19 -
 20
20 -
 21
21 -
 22
22 -
23
-
24
-
25
-
26
-
27
-
28
-
29
-
30
-
31
-
32
-
33
-
34
-
35
-
36
-
37
-
38
-
39
 |
 |
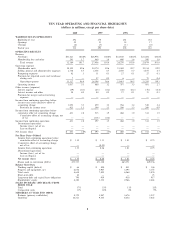
MANAGEMENT'S DISCUSSION AND ANALYSIS OF FINANCIAL CONDITION
AND RESULTS OF OPERATIONS
Certain statements contained in this document constitute forward-looking statements within the meaning
of the Private Securities Litigation Reform Act of 1995. For these purposes, forward-looking statements are
statements that address activities, events, conditions or developments that the company expects, or anticipates
may occur in the future. Such forward-looking statements involve risks and uncertainties that may cause
actual events, results or performance to diÅer materially from those indicated by such statements. These risks
and uncertainties include, but are not limited to, domestic and international economic conditions including
exchange rates, the eÅects of competition and regulation, conditions aÅecting the acquisition, development,
ownership or use of real estate, actions of vendors, and other risks identiÑed from time to time in the
Company's public statements and reports Ñled with the SEC.
The Company's Board of Directors approved a 2-for-1 stock split of Costco Common Stock whereby
shareholders of record received one additional share of common stock for every share held on the record date
of December 24, 1999. The common stock began trading at a post-split price on January 14, 2000, and all per
share data reÖects that 2-for-1 stock split.
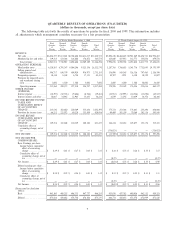
Comparison of Fiscal 2000 (53 weeks) and Fiscal 1999 (52 weeks):
(dollars in thousands, except earnings per share)
Net income for Ñscal 2000, a 53-week Ñscal year, increased 59% to $631,437, or $1.35 per diluted share,
from $397,298, or $0.86 per diluted share during Ñscal year 1999, a 52-week Ñscal year. Net income for Ñscal
1999 was impacted by both a $50,000 fourth quarter pre-tax provision for impaired assets and warehouse
closing costs, as well as the one-time $118,023 non-cash, after-tax charge recorded in the Ñrst quarter of Ñscal
1999, reÖecting the cumulative eÅect of the Company's change in accounting for membership fees from a
cash to a deferred method. Excluding the impact of these two charges, net income in Ñscal 1999 would have
been $545,321, or $1.18 per diluted share and would have resulted in a 16% increase in net income in Ñscal
2000 compared to Ñscal 1999.
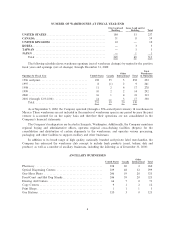
Net sales increased 17% to $31,620,723 in Ñscal 2000 from $26,976,453 in Ñscal 1999. This increase was
due to: (i) higher sales at existing locations opened prior to Ñscal 1999; (ii) increased sales at 14 warehouses
(21 opened, 7 closed) that were opened in Ñscal 1999 and in operation for the entire 2000 Ñscal year; (iii) Ñrst
year sales at the 21 new warehouses opened (25 opened, 4 closed) during Ñscal 2000; and (iv) Ñscal 2000
being a 53-week Ñscal year. Changes in prices did not materially impact sales levels.
Comparable sales, that is sales in warehouses open for at least a year, increased at an 11% annual rate in
Ñscal 2000 compared to a 10% annual rate during Ñscal 1999.
Membership fees and other revenue increased 13% to $543,573, or 1.72% of net sales, in Ñscal 2000 from
$479,578, or 1.78% of net sales, in Ñscal 1999. This increase was primarily due to membership sign-ups at the
21 new warehouses opened in Ñscal 2000.
Gross margin (deÑned as net sales minus merchandise costs) increased 18% to $3,298,553, or 10.43% of
net sales, in Ñscal 2000 from $2,806,254, or 10.40% of net sales, in Ñscal 1999. Gross margin as a percentage of
net sales increased due to increased sales penetration of certain higher gross margin ancillary businesses and
private label products and improved performance of the Company's international operations. The gross margin
Ñgures reÖect accounting for most U.S. merchandise inventories on the last-in, Ñrst-out (LIFO) method. If all
inventories had been valued using the Ñrst-in, Ñrst-out (FIFO) method, inventories would have been higher by
$8,150 at September 3, 2000, and $11,150 at August 29, 1999.
Selling, general and administrative expenses as a percent of net sales increased to 8.71% during Ñscal
2000 from 8.67% during Ñscal 1999, primarily reÖecting higher expenses associated with international
expansion, the rollout of certain ancillary businesses and an increase in credit card merchant fees associated
with the rollout of a new co-branded credit card program which was partially oÅset by a year-over-year
improvement in the Company's core warehouse operations driven by an increase in comparable warehouse
sales and improvements within Central and Regional administrative oÇces.
10