Costco 2000 Annual Report Download - page 3
Download and view the complete annual report
Please find page 3 of the 2000 Costco annual report below. You can navigate through the pages in the report by either clicking on the pages listed below, or by using the keyword search tool below to find specific information within the annual report.-
 1
1 -
 2
2 -
 3
3 -
 4
4 -
 5
5 -
 6
6 -
 7
7 -
 8
8 -
 9
9 -
 10
10 -
 11
11 -
 12
12 -
 13
13 -
 14
14 -
15
-
16
-
17
-
18
-
19
-
20
-
21
-
22
-
23
-
24
-
25
-
26
-
27
-
28
-
29
-
30
-
31
-
32
-
33
-
34
-
35
-
36
-
37
-
38
-
39
 |
 |
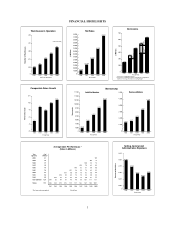
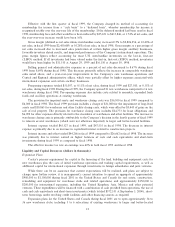
Warehouses in Operation
At Fiscal Year End
Number of Warehouses
350
325
1996 1997 1998 1999 2000
300
275
252
261
292
313
(330 at 12/31/00)
278
250
0
Net Sales
Fiscal Year
$ Millions
32,000
31,000
30,000
29,000
28,000
27,000
26,000
25,000
24,000
23,000
22,000
21,000
20,000
19,000
01996 1997 1998 1999 2000
19,214
21,484
26,976
31,621
23,830
Net Income
Fiscal Year
$ Millions
1996 1997 1998 1999 2000
200
300
400
500
600
700
0
*
** Income from continuing operations
Income from continuing operations excluding asset impairment/
warehouse closing costs and/or accounting change
460*
545**
Closing/
Impairment
Asset
Impairment
Accounting
Change
351**
312*
515**
397*
249*
631*
Comparable Sales Growth
Fiscal Year
Percent Increase
1996 1997 1998 1999 2000
5%
9%
10%
11%
8%
0%
4%
6%
8%
10%
12%
Average Sales Per Warehouse *
(Sales In Millions)
Fiscal Year
*First year sales annualized
1999
87
90
90
68
82
85
58
$65
111
$94
1998
80
84
83
61
76
70
$50
101
$87
1997
75
79
76
53
69
$56
95
$83
1996
69
74
68
$46
58
88
$77
1995
65
69
60
$51
85
$75
1994
61
62
$57
87
$76
1993
54
$59
88
$78
1992
$48
92
$84
1991
$86
$86
313Totals
1271991 & Before
261992
341993
271994
191995
181996
101997
171998
141999
212000
Whses*Opened # ofYear
2000
96
98
99
80
92
99
72
77
121
$101
$55
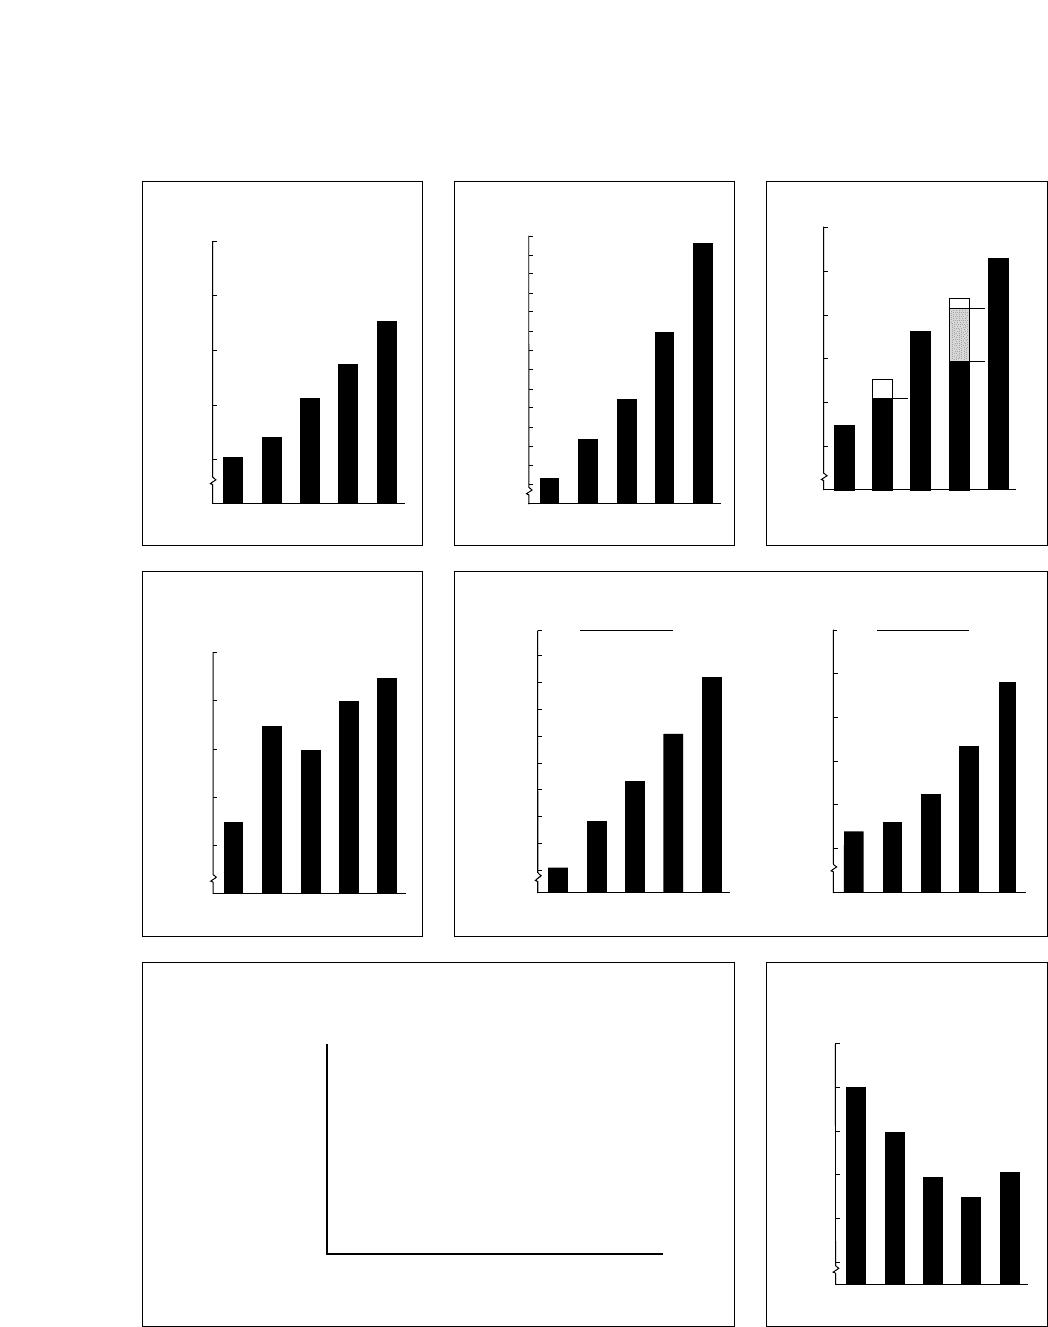
Selling, General and
Administrative Expenses
Fiscal Year
Percent of Net Sales
1996 1997 1998 1999 2000
8.80%
8.74%
8.67%
8.71%
8.69%
8.70%
8.65%
8.75%
8.85%
0
8.80%
8.60%
Fiscal Year
1996 1997 1998 1999 2000
3,435 3,537
3,887
4,170
3,676
3,400
3,600
3,800
4,000
4,200
4,400
0
Business Members
Fiscal Year
Thousands
1996 1997 1998 1999 2000
7,076
7,845
9,555
10,521
8,654
0
8,500
7,500
9,500
10,500
11,500
8,000
7,000
9,000
10,000
11,000
Gold Star Members
Membership
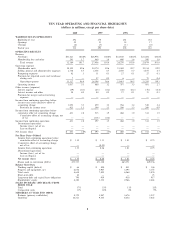
FINANCIAL HIGHLIGHTS
1