Clearwire 2007 Annual Report Download - page 63
Download and view the complete annual report
Please find page 63 of the 2007 Clearwire annual report below. You can navigate through the pages in the report by either clicking on the pages listed below, or by using the keyword search tool below to find specific information within the annual report.-
 1
1 -
2
-
3
-
4
-
5
-
6
-
7
-
8
-
9
-
10
-
11
-
12
-
13
-
14
-
15
-
16
-
17
-
18
-
19
-
20
-
21
-
22
-
23
-
24
-
25
-
26
-
27
-
28
-
29
-
30
-
31
-
32
-
33
-
34
-
35
-
36
-
37
-
38
-
39
-
40
-
41
-
42
-
43
-
44
-
45
-
46
-
47
-
48
-
49
-
50
-
51
-
52
-
 53
53 -
 54
54 -
 55
55 -
 56
56 -
 57
57 -
 58
58 -
 59
59 -
 60
60 -
 61
61 -
 62
62 -
 63
63 -
 64
64 -
 65
65 -
 66
66 -
 67
67 -
 68
68 -
 69
69 -
 70
70 -
 71
71 -
 72
72 -
 73
73 -
74
-
75
-
76
-
77
-
78
-
79
-
80
-
81
-
82
-
83
-
84
-
85
-
86
-
87
-
88
-
89
-
90
-
91
-
92
-
93
-
94
-
95
-
96
-
97
-
98
-
99
-
100
-
101
-
102
-
103
-
104
-
105
-
106
-
107
-
108
-
109
-
110
-
111
-
112
-
113
-
114
-
115
-
116
-
117
-
118
-
119
-
120
-
121
-
122
-
123
-
124
-
125
-
126
-
127
-
128
 |
 |

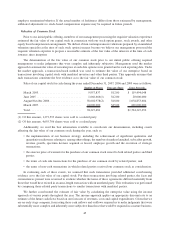
acquisition of other companies, or any combination of the foregoing. Additionally, as our operations grow and
expand, it may become more difficult to modulate our business plans and strategies based on the availability of
funding. We will likely seek significant additional debt financing or refinance existing indebtedness, in both the
short-term and the long-term, to continue to fund our liquidity needs and capital resource requirements.
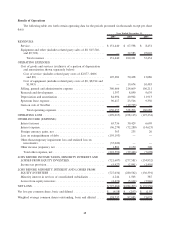
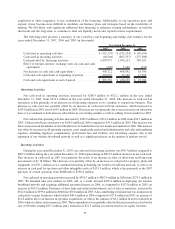
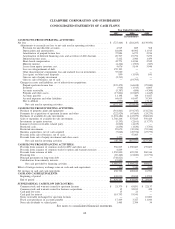
The following table presents a summary of our cash flows and beginning and ending cash balances for the
years ended December 31, 2007, 2006 and 2005 (in thousands):
2007 2006 2005
Year Ended December 31,
Cash used in operating activities .................... $ (522,135) $ (233,154) $ (96,655)
Cash used in investing activities ..................... (46,294) (867,557) (275,300)
Cash provided by financing activities ................. 1,007,571 1,504,213 389,181
Effect of foreign currency exchange rates on cash and cash
equivalents .................................. (420) 5,340 (636)
Net increase in cash and cash equivalents .............. 438,722 408,842 16,590
Cash and cash equivalents at beginning of period ........ 438,030 29,188 12,598
Cash and cash equivalents at end of period............. $ 876,752 $ 438,030 $ 29,188
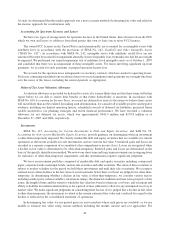
Operating Activities
Net cash used in operating activities increased by $288.9 million to $522.1 million in the year ended
December 31, 2007, from $233.2 million in the year ended December 31, 2006. The increase in cash used in
operations is due primarily to an increase in all operating expenses as we continue to expand our business. This
increase in cash used was partially offset by an increase in cash received from customers, which increased to
$155.0 million in 2007 from $104.9 million in 2006. This increase was primarily due to an increase in our subscriber
base as we continued to both increase subscribers in our existing markets as well as adding 14 new markets in 2007.
Net cash used in operating activities increased by $136.5 million to $233.2 million in 2006, from $96.7 million in
2005. Cash received from customers was $104.9 million in 2006 compared to $31.6 million in 2005. This increase was
due to an increase in the number of our subscribers as we launched our service in nine new markets in 2006. This increase
was offset by increases in all operating expenses, most significantly general and administrative and sales and marketing
expenses, including employee compensation, professional fees and facilities and advertising expense, due to the
expansion of our wireless broadband network as well as a significant increase in the number of markets served.
Investing Activities
During the year ended December 31, 2007, net cash used in investing activities was $46.3 million compared to
$867.6 million during the year ended December 31, 2006 representing an $821.3 million decrease in net cash used.
This decrease in cash used in 2007 was primarily the result of an increase in sales of short-term and long-term
investments of $1.18 billion. This decrease was partially offset by an increase in cash paid for property, plant and
equipment of $170.1 million as we continued investing in building our wireless broadband network, as well as an
increase in cash paid for spectrum and other intangible assets of $155.3 million, which is due primarily to the 2007
purchase of owned spectrum from BellSouth of $196.8 million.
Net cash used in investing activities increased by $592.3 million to $867.6 million in 2006 from $275.3 million in
2005. We launched nine new markets in 2006, and, as a result, invested $259.4 million in deploying our wireless
broadband network and acquiring additional spectrum licenses in 2006, as compared to $157.0 million in 2005, an
increase of $102.4 million. Purchases of short-term and restricted investments, net of sales or maturities, increased by
$522.6 million to $599.4 million in 2006 from $76.8 million in 2005. Also contributing to this increase was an increase in
cash paid to acquire businesses which totaled $49.6 million in 2006 compared to $27.8 million in 2005, an increase of
$21.8 million due to an increase in spectrum acquisitions, as well as the issuance of $4.1 million in notes receivable in
2006, while we did no such issuance in 2005. These expenditures were partially offset by the net proceeds received on the
sale of NextNet totaling $47.1 million and a reduction of $11.5 million in cash invested in our equity investees.
55