Clearwire 2007 Annual Report Download - page 57
Download and view the complete annual report
Please find page 57 of the 2007 Clearwire annual report below. You can navigate through the pages in the report by either clicking on the pages listed below, or by using the keyword search tool below to find specific information within the annual report.-
 1
1 -
2
-
3
-
4
-
5
-
6
-
7
-
8
-
9
-
10
-
11
-
12
-
13
-
14
-
15
-
16
-
17
-
18
-
19
-
20
-
21
-
22
-
23
-
24
-
25
-
26
-
27
-
28
-
29
-
30
-
31
-
32
-
33
-
34
-
35
-
36
-
37
-
38
-
39
-
40
-
41
-
42
-
43
-
44
-
45
-
46
-
 47
47 -
 48
48 -
 49
49 -
 50
50 -
 51
51 -
 52
52 -
 53
53 -
 54
54 -
 55
55 -
 56
56 -
 57
57 -
 58
58 -
 59
59 -
 60
60 -
 61
61 -
 62
62 -
 63
63 -
 64
64 -
 65
65 -
 66
66 -
 67
67 -
68
-
69
-
70
-
71
-
72
-
73
-
74
-
75
-
76
-
77
-
78
-
79
-
80
-
81
-
82
-
83
-
84
-
85
-
86
-
87
-
88
-
89
-
90
-
91
-
92
-
93
-
94
-
95
-
96
-
97
-
98
-
99
-
100
-
101
-
102
-
103
-
104
-
105
-
106
-
107
-
108
-
109
-
110
-
111
-
112
-
113
-
114
-
115
-
116
-
117
-
118
-
119
-
120
-
121
-
122
-
123
-
124
-
125
-
126
-
127
-
128
 |
 |
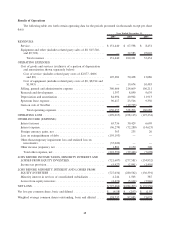
Year Ended December 31, 2007 Compared to Year Ended December 31, 2006
Revenue. Service revenue is primarily generated from subscription and modem lease fees for our wireless
broadband service. Revenue from our acquired businesses, activation fees and fees for other services such as email,
VoIP, and web hosting services are also included in service revenue. Our equipment and other revenue include sales
of NextNet equipment through the date of sale of NextNet in August 2006.
Total revenue increased $51.2 million to $151.4 million in 2007 from $100.2 million in 2006. This includes an
$83.8 million increase in service revenue as we increased our subscriber base, offset partially by a decrease in
equipment revenue of $32.6 million from our NextNet operations due to the sale of NextNet in August 2006.
Service revenues were $151.4 million in the year ended December 31, 2007 compared to $67.6 million in the
year ended December 31, 2006. As of December 31, 2007, we operated in 46 U.S. markets and four international
markets covering a geographic area containing approximately 16.3 million people. This is compared to 34 U.S. and
two international markets covering approximately 9.6 million people as of December 31, 2006. Total subscribers in
all markets grew from approximately 206,000 as of December 31, 2006 to approximately 394,000 as of
December 31, 2007, primarily due to continued subscriber growth in existing markets and the additional markets
launched during 2007. We expect service revenues to increase in 2008 as we expect our subscribers to increase to
approximately 510,000 to 530,000.
Revenue in the U.S. represented 81.2% and international represented 18.8% of total revenue in 2007 compared
to 83.3% and 16.7% in 2006, respectively. This increase was due primarily to the increase in subscribers
internationally which grew 102.5% over the prior year compared to an 89.9% increase in U.S. subscribers.
Equipment and other revenue in the year ended December 31, 2007 decreased from the year ended
December 31, 2006 due to the sale of NextNet in August 2006.
Cost of goods and services. Service costs primarily include costs associated with tower rents, direct Internet
access costs and back haul costs, which is the transporting of data traffic between distributed sites and a central point
in the market or Point of Presence (“POP”). Our cost of equipment consists of costs incurred for equipment
manufactured by NextNet through August 2006.
There were no costs related to equipment in the year ended December 31, 2007 due to the sale of NextNet in
August 2006.
Total cost of goods and services increased $37.2 million to $107.3 million in 2007 from $70.1 million in 2006.
Cost of services were $107.3 million in the year ended December 31, 2007 compared to $50.4 million in the year
ended December 31, 2006. These increases were primarily due to an increase in the number of sites on-air, direct
internet access and related back haul costs, as the number of on-air sites increased to approximately 2,360 at
December 31, 2007 compared to approximately 1,310 at December 31, 2006. In both 2007 and 2006, in anticipation
of build-out and future market launches, we also had tower lease expenses for markets under construction.
As a percentage of service revenue, cost of service decreased to 70.8% in the year ended December 31, 2007
from 74.6% in the year ended December 31, 2006, primarily as a result of our costs of services rising at a slower rate
as compared to our revenues generated from our increased subscriber base. While our cost of service will increase as
we continue to expand our network, we anticipate that cost of service as a percent of revenue will fluctuate due to
new market launches and growth in subscribers. Based on the Company’s current circumstances, most of our 2008
new market launches are scheduled for late in the year. As a consequence we expect steady improvement in cost of
service as a percentage of revenue during the first part of the year, with some reduction late in the year as new market
launches occur.
U.S. cost of goods and services represented approximately 88.1% and international represented approximately
11.9% of total cost of goods and services in 2007 compared to approximately 87.2% and approximately 12.8% in
2006, respectively. This increase in U.S. costs of goods and services as a percent of total cost of goods and services
is due primarily to increase lease and site costs related to an increased number of sites being built out in the U.S. as
compared to international.
49