Clearwire 2007 Annual Report Download - page 62
Download and view the complete annual report
Please find page 62 of the 2007 Clearwire annual report below. You can navigate through the pages in the report by either clicking on the pages listed below, or by using the keyword search tool below to find specific information within the annual report.-
 1
1 -
2
-
3
-
4
-
5
-
6
-
7
-
8
-
9
-
10
-
11
-
12
-
13
-
14
-
15
-
16
-
17
-
18
-
19
-
20
-
21
-
22
-
23
-
24
-
25
-
26
-
27
-
28
-
29
-
30
-
31
-
32
-
33
-
34
-
35
-
36
-
37
-
38
-
39
-
40
-
41
-
42
-
43
-
44
-
45
-
46
-
47
-
48
-
49
-
50
-
51
-
 52
52 -
 53
53 -
 54
54 -
 55
55 -
 56
56 -
 57
57 -
 58
58 -
 59
59 -
 60
60 -
 61
61 -
 62
62 -
 63
63 -
 64
64 -
 65
65 -
 66
66 -
 67
67 -
 68
68 -
 69
69 -
 70
70 -
 71
71 -
 72
72 -
73
-
74
-
75
-
76
-
77
-
78
-
79
-
80
-
81
-
82
-
83
-
84
-
85
-
86
-
87
-
88
-
89
-
90
-
91
-
92
-
93
-
94
-
95
-
96
-
97
-
98
-
99
-
100
-
101
-
102
-
103
-
104
-
105
-
106
-
107
-
108
-
109
-
110
-
111
-
112
-
113
-
114
-
115
-
116
-
117
-
118
-
119
-
120
-
121
-
122
-
123
-
124
-
125
-
126
-
127
-
128
 |
 |
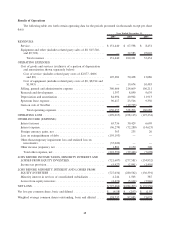
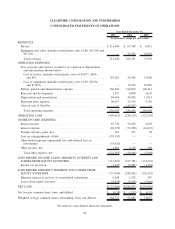
Spectrum lease expense. Spectrum lease expense increased $14.1 million to $23.5 million in 2006 from
$9.4 million in 2005. As certain of our leases include escalation clauses, we are required to record expense on a
straight-line basis over the term of these leases, including renewal periods where appropriate. Total spectrum lease
expense increased as a direct result of an increase in the number of spectrum licenses leased as part of the
deployment of our wireless broadband network.
Gain on sale of NextNet. The sale of NextNet in August 2006 resulted in a gain of $19.8 million, comprised
of net proceeds from the sale of $47.1 million less the book value of net assets sold of $26.1 million and transaction
related costs of $1.2 million.
Operating loss. As a result of the above, operating loss increased from $127.2 million in 2005 to
$238.1 million in 2006.
Interest income. We recognized $30.4 million of interest income in 2006 compared to $6.6 million in 2005.
This increase is due to an increase in our total short-term and long-term investments.
Interest expense, net. We incurred $72.3 million of net interest expense in 2006 compared to $14.6 million in
2005. This increase in net interest expense is due to the issuance in August 2005 of senior secured notes, due 2010,
in an aggregate principal amount of $260.3 million, and the issuance in February 2006 of additional senior secured
notes, due 2010, in an aggregate principal amount of $360.4 million, as well as additional loans totaling
$135.0 million. We recorded interest expense totaling $69.1 million, including $63.2 million related to our senior
secured notes in 2006. We also recorded amortization of original issuance discount of $15.8 million and deferred
financing costs of $3.9 million related to our senior secured notes. These amounts were partially offset by
capitalized interest of $16.6 million in 2006. In the year ended December 31, 2005, we recorded interest expense
totaling $11.6 million related to our notes, $4.4 million of amortization of original issuance discount, and deferred
financing costs of $898,000, partially offset by $2.3 million of capitalized interest.
Other income (expense), net. We recognized $2.2 million of other income in 2006 as compared to $300,000
of other income in 2005. This increase was due primarily to the sale of spectrum assets in 2006.
Income tax provision. We incurred $3.0 million of income tax expense in 2006 as compared to $1.5 million in
2005. The expense represents the recognition of a deferred tax liability related to the accounting for FCC licenses
we own. Owned FCC licenses are amortized over 15 years for U.S. tax purposes but, since these licenses have an
indefinite life, they are not amortized for financial statement reporting purposes. The ongoing difference between
the financial statements and tax amortization treatment resulted in our recording a deferred income tax expense of
$3.0 million 2006.
Losses from equity investees, net. Losses from equity investees — net increased $1.2 million to $5.1 million
in 2006 from $3.9 million in 2005. The increase is due to continued losses from our equity investee MVS Net S.A.
de C.V. in Mexico, as well as losses from our equity investee Danske Telecom A/S in Denmark that we invested in
during June 2005.
Net loss. As a result of the above, our net loss increased to $284.2 million in 2006 as compared to
$140.0 million in 2005.
Liquidity and Capital Resource Requirements
Based upon our current plans, we believe that our existing cash, cash equivalents and marketable securities will
be sufficient to cover our estimated liquidity needs for at least the next twelve months, although we may raise
additional capital during that period if available on terms we believe are attractive. Our long-term economic model
is designed to allow replicable, scalable individual market builds so that we can increase or decrease our market
deployment schedule based on available funds. As a result, the amount and timing of our long-term capital needs
will depend on the extent of our network deployment and, to a lesser degree, on the schedule on which mobile
WiMAX technologies become commercially available. As our business is in its early stages, we regularly evaluate
our plans and strategy, and these evaluations often result in changes, some of which may be material and may
significantly modify our cash requirements. These changes in our plans or strategy may include the introduction of
new features or services, significant or enhanced distribution arrangements, investments in infrastructure,
54