Blackberry 2001 Annual Report Download - page 25
Download and view the complete annual report
Please find page 25 of the 2001 Blackberry annual report below. You can navigate through the pages in the report by either clicking on the pages listed below, or by using the keyword search tool below to find specific information within the annual report.-
 1
1 -
2
-
3
-
4
-
5
-
6
-
7
-
8
-
9
-
10
-
11
-
12
-
13
-
14
-
 15
15 -
 16
16 -
 17
17 -
 18
18 -
 19
19 -
 20
20 -
 21
21 -
 22
22 -
 23
23 -
 24
24 -
 25
25 -
 26
26 -
 27
27 -
 28
28 -
 29
29 -
 30
30 -
 31
31 -
 32
32 -
 33
33 -
 34
34 -
 35
35 -
36
-
37
-
38
-
39
-
40
 |
 |

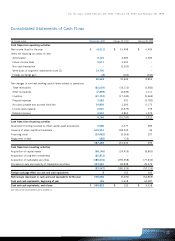
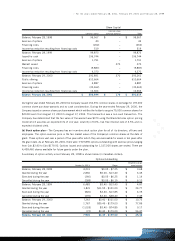
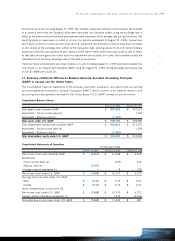
>For the years ended February 28, 2001, February 29, 2000 and February 28, 1999
Consolidated Statements of Cash Flows
For the year ended February 28, 2001 February 29, 2000 February 28, 1999
Cash flows from operating activities
Net income (loss) for the year $ (6,211) $ 10,498 $ 6,409
Items not requiring an outlay of cash:
Amortization 9,123 4,683 2,783
Future income taxes 5,011 3,650 –
Non-cash transaction –(3,000) –
Write-down of long-term investments (note 11) 14,750 ––
Foreign exchange gain (8) (162) (342)
22,665 15,669 8,850
Net changes in non-cash working capital items related to operations:
Trade receivables (23,029) (16,110) (3,582)
Other receivables (7,859) (4,649) 1,111
Inventory (31,192) (17,040) (9,469)
Prepaid expenses 3,082 931 (3,782)
Accounts payable and accrued liabilities 34,859 3,269 6,173
Income taxes payable 2,027 (2,679) 735
Deferred revenue 4,593 4,862 1,274
5,146 (15,747) 1,310
Cash flows from financing activities
Government funding received to offset capital asset acquisitions 2,585 2,177 289
Issuance of share capital and warrants 615,551 198,535 49
Financing costs (30,462) (9,065) 257
Repayment of debt (185) (15) –
587,489 191,632 595
Cash flows from investing activities
Acquisition of capital assets (68,146) (24,419) (8,860)
Acquisition of long-term investments (20,812) ––
Acquisition of marketable securities (388,672) (259,968) (77,630)
Proceeds on sale and maturity of marketable securities 393,683 98,848 29,374
(83,947) (185,539) (57,116)
Foreign exchange effect on cash and cash equivalents 8162 342
Net increase (decrease) in cash and cash equivalents for the year 508,696 (9,492) (54,869)
Cash and cash equivalents, beginning of year 126 9,618 64,487
Cash and cash equivalents, end of year $ 508,822 $ 126 $ 9,618
See notes to the consolidated financial statements.
>23