Bed, Bath and Beyond 2007 Annual Report Download - page 8
Download and view the complete annual report
Please find page 8 of the 2007 Bed, Bath and Beyond annual report below. You can navigate through the pages in the report by either clicking on the pages listed below, or by using the keyword search tool below to find specific information within the annual report.-
 1
1 -
 2
2 -
 3
3 -
 4
4 -
 5
5 -
 6
6 -
 7
7 -
 8
8 -
 9
9 -
 10
10 -
 11
11 -
 12
12 -
 13
13 -
 14
14 -
 15
15 -
 16
16 -
 17
17 -
 18
18 -
 19
19 -
20
-
21
-
22
-
23
-
24
-
25
-
26
-
27
-
28
-
29
-
30
-
31
-
32
-
33
-
34
-
35
-
36
-
37
-
38
-
39
-
40
-
41
-
42
-
43
-
44
-
45
-
46
-
47
-
48
-
49
-
50
-
51
-
52
-
53
-
54
-
55
-
56
-
57
-
58
-
59
-
60
-
61
-
62
-
63
-
64
-
65
-
66
-
67
-
68
 |
 |

BED BATH& BEYOND ANNUAL REPORT 2007
6
EXPANSION PROGRAM
The Company is engaged in an ongoing expansion program involving the opening of new stores in both new and existing
markets, the expansion or relocation of existing stores and the continuous review of strategic acquisitions. In the sixteen year
period from the beginning of fiscal 1992 to the end of fiscal 2007, the chain has grown from 34 to 971 stores. Total square
footage grew from 917,000 square feet at the beginning of fiscal 1992 to 30.2 million square feet at the end of fiscal 2007.
The Company opened its first international BBB store in Ontario, Canada in December 2007 and is actively pursuing its expansion
opportunities in Canada. In addition, the Company continues to explore other international opportunities.
The Company intends to continue its expansion program and currently expects to open approximately 50 to 55 new BBB stores
throughout the United States and Canada in fiscal 2008. The Company also expects to open approximately 12 new CTS stores and
several buybuy BABY stores as well as continue to open new Harmon stores (see details under “Liquidity and Capital Resources”
below). The continued growth of the Company is dependent, in large part, upon the Company’s ability to execute its expansion
program successfully.
LIQUIDITY AND CAPITAL RESOURCES
Fiscal 2007 compared to Fiscal 2006
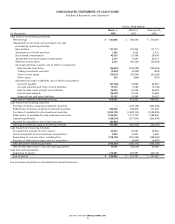
The Company has been able to finance its operations, including its expansion program, through internally generated funds. Net
cash provided by operating activities in fiscal 2007 was $614.5 million, compared with $613.6 million in fiscal 2006. Year over year,
the Company experienced an increase in cash provided by net earnings, as adjusted for non-cash expenses (primarily deferred
taxes and depreciation), which was offset by a decrease in the net components of working capital (primarily decreases in accounts
payable and income taxes offset by an increase in merchandise inventories).
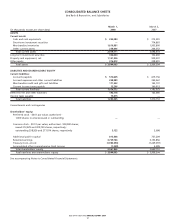
Inventory per square foot was $53.58 and $54.18 as of March 1, 2008 and March 3, 2007, respectively. The Company continues to
focus on optimizing inventory productivity while maintaining appropriate in-store merchandise levels to support sales growth.
Net cash provided by investing activities in fiscal 2007 was $101.7 million, compared with net cash used in investing activities of
$397.7 million in fiscal 2006. The increase in net cash provided by investing activities was attributable to an increase in the
redemptions of investment securities, net of purchases, that was partially offset by the payment of $85.9 million for the acquisi-
tion of buybuy BABY and an increase in capital expenditures to $358.2 million in fiscal 2007 from $317.5 million in fiscal 2006.
Net cash used in financing activities in fiscal 2007 was $705.5 million, compared with $250.3 million in fiscal 2006. The increase
in net cash used in financing activities was primarily attributable to common stock repurchased of $734.2 million in fiscal 2007
compared to $301.0 million in fiscal 2006 under the Company’s stock repurchase program.
Fiscal 2006 compared to Fiscal 2005
Net cash provided by operating activities in fiscal 2006 was $613.6 million, compared with $660.4 million in fiscal 2005. The
decrease in net cash provided by operating activities was principally driven by working capital changes due to the increase in
merchandise inventories (primarily as a result of new store space) and an increase in other current assets (due to the timing of
prepayments), partially offset by an increase in net earnings and an increase in accrued expenses and other current liabilities
(primarily due to the timing of payments). Inventory per square foot was $54.18 and $51.04 as of March 3, 2007 and February 25,
2006, respectively.
Net cash used in investing activities in fiscal 2006 was $397.7 million, compared with $67.6 million in fiscal 2005. The increase
in net cash used in investing activities was attributable to a decrease in redemptions of investment securities and an increase in
capital expenditures partially offset by a decrease in purchases of investment securities.
Net cash used in financing activities in fiscal 2006 was $250.3 million, compared with $567.3 million in fiscal 2005. The decrease
in net cash used in financing activities was primarily attributable to common stock repurchased of $301.0 million in fiscal 2006
compared to $598.2 million in fiscal 2005 under the Company’s stock repurchase program.
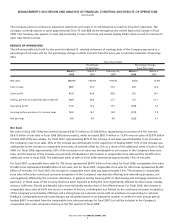
MANAGEMENT’S DISCUSSION AND ANALYSIS OF FINANCIAL CONDITION AND RESULTS OF OPERATIONS
(continued)